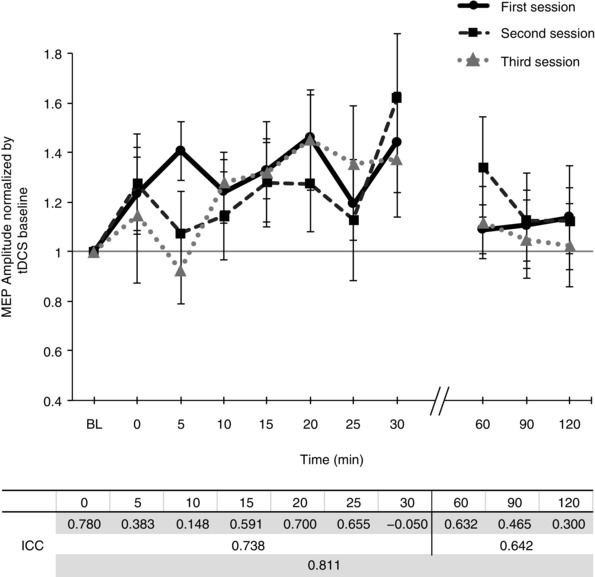
Figure 4. Intra‐individual response to 1.0 mA anodal tDCS.

Time courses of cortical excitability, measured as MEP amplitudes normalized to baseline, in a subgroup of 7 participants across three separate sessions are shown. Error bars represent standard error. In the table below, the intra‐class correlation coefficient (ICC(2,1)) was used to assess the strength of the reliability and reproducibility of 1.0 mA anodal tDCS, at each time point (first row), as well as over first 30 min and final 60 min (second and third row, respectively).
