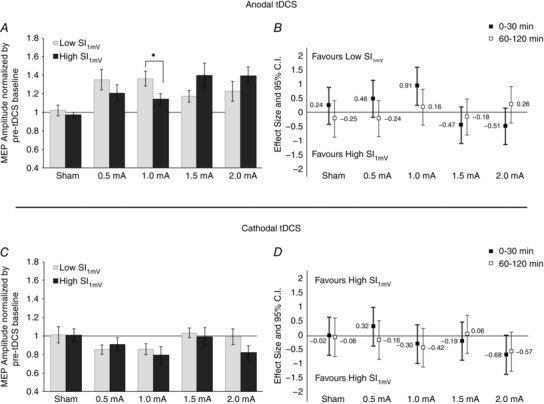
Figure 5. Differences in anodal and cathodal tDCS‐induced excitability between subjects with low and high sensitivity to TMS.

The sample was median‐split (anodal: 48%; cathodal: 46%) with ‘Low SI1mV’ consisting of participants who required less than the median value to achieve an MEP amplitude of 1 mV and ‘High SI1mV’ consisting of the rest. Pairwise comparisons (panels A and C) between subgroups of the pooled average from the first 30 min were conducted using Student's unpaired, two‐tailed t test. Error bars represent the standard error. *Significant differences between the groups (P < 0.05). Effect size comparisons (panels B and D) were conducted by calculating Cohen's d. Error bars represent 95% confidence intervals of the pooled variance. A, subjects with Low SI1mV showed significantly greater increases in 1.0 mA anodal tDCS compared to subjects with High SI1mV. Note that within the sub‐groups, 1.0 mA was not significantly better than 1.5 mA (P = 0.081) for subjects with Low SI1mV and 1.5 mA was not significantly better than 1.0 mA (P = 0.073) for the subjects with High SI1mV. B, intensity effects for the first 30 min appear to follow a trend‐wise pattern, whereby lower intensities favour subjects with Low SI1mV while higher intensities favour subjects with High SI1mV. C, a subgroup comparison of cathodal tDCS does not reveal any significant pairwise difference during the first 30 min. D, effect size comparisons (where larger effects equate to greater reduction of cortical excitability) show a marginal intensity‐dependent tendency for the lowest (0.5 mA) and highest (2.0 mA) intensity only, which also follows the same pattern as anodal tDCS.
