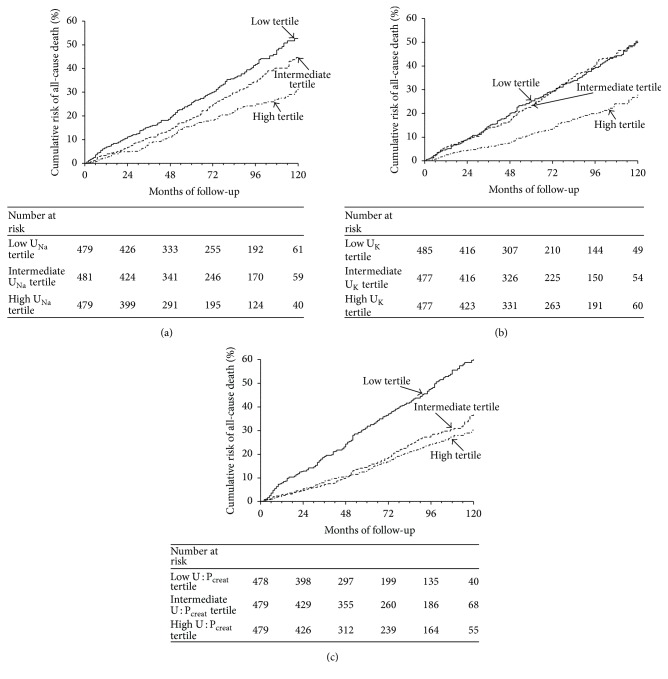
Figure 1.
Cumulative risk of all-cause death according to urinary solute tertiles. (a) Kaplan-Meier survival curves are displayed according to tertiles of urinary sodium concentration (UNa) at baseline. Patient grouping: solid line indicates high UNa tertile patients; dashed line indicates intermediate UNa tertile patients; dotted line indicates low UNa tertile patients. P value Log-rank test < 0.001. (b) Kaplan-Meier survival curves are displayed according to tertiles of urinary potassium concentrations (UK) at baseline. Patient grouping: solid line indicates high UK tertile patients; dashed line indicates intermediate UK tertile patients; dotted line indicates low UK tertile patients. P value Log-rank test < 0.001. (c) Kaplan-Meier survival curves are displayed according to tertiles of urine to plasma creatinine concentration ratio (U : Pcreat) at baseline. Patient grouping: solid line indicates high U : Pcreat tertile patients; dashed line indicates intermediate U : Pcreat tertile patients; dotted line indicates low U : Pcreat tertile patients. P value Log-rank test < 0.001.

