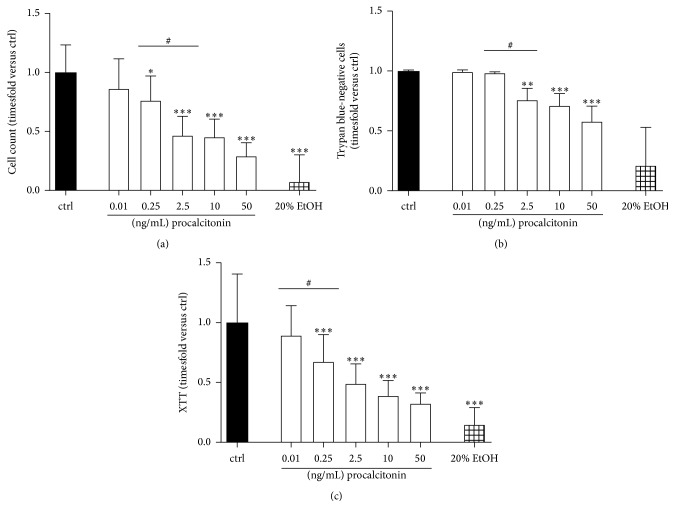
Figure 3.
(a) Cell counts (n = 9–18), (b) number of trypan blue-negative cells (n = 9–18), and (c) XTT metabolization (n = 18–36 biological replicates) of L929 fibroblasts following exposure to procalcitonin for 2 × 72 h in concentrations as indicated. EtOH ethanol 20%. n = 18–28 biological replicates; ∗P < 0.05, ∗∗P < 0.01, and ∗∗∗P < 0.001 versus ctrl; #P < 0.05 versus as indicated. Significance between concentrations is only indicated if differences between consecutive concentrations employed reach statistical significance.

