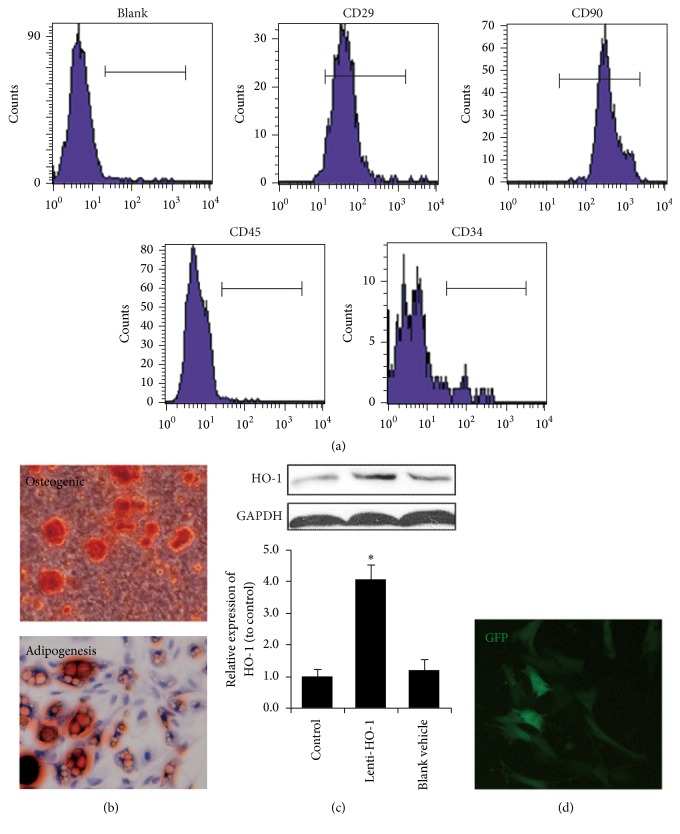
Figure 1.
Characteristics of MSC and HO-1 transduction by lentiviral vectors. (a) Flow cytometry demonstrated that most MSC expressed CD29 and CD90 but less CD45 and CD34. (b) Multipotency of MSC, differentiating into adipocytes stained by Oil Red O and osteocytes stained by Alizarin Red S. (c) HO-1 expressions in control and MSC transduced with lenti-HO-1 and blank vehicle, n = 5. (d) GFP image of MSC after transduction by lentiviral vectors. ∗P < 0.01 compared with control.

