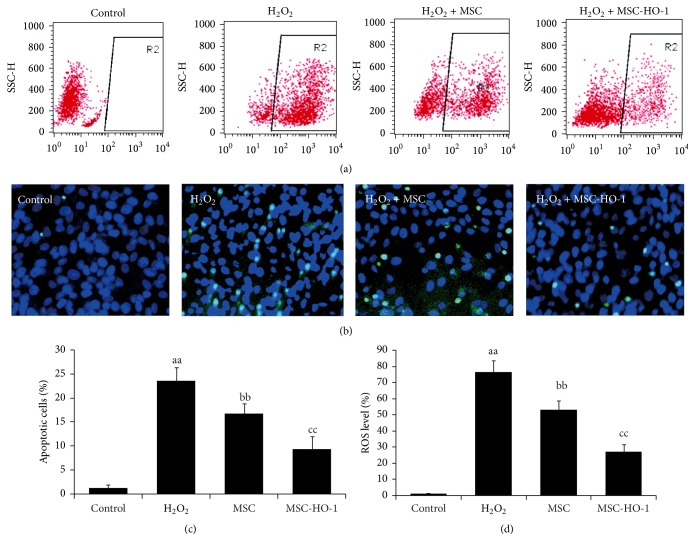
Figure 2.
The effects of HO-1 overexpression in MSC on intracellular ROS levels and apoptosis. MSC or MSC-HO-1 were indirectly cocultivated with RGC-5 after adding H2O2. (a) Intracellular ROS levels in RGC-5 were analyzed by flow cytometry. (b) Representative TUNEL images of RGC-5. (c) and (d) The quantitative detection of ROS levels and apoptosis of RGC-5 (n = 5). aaP < 0.01 compared with control; bbP < 0.01 compared with H2O2 group; ccP < 0.01 compared with MSC group.

