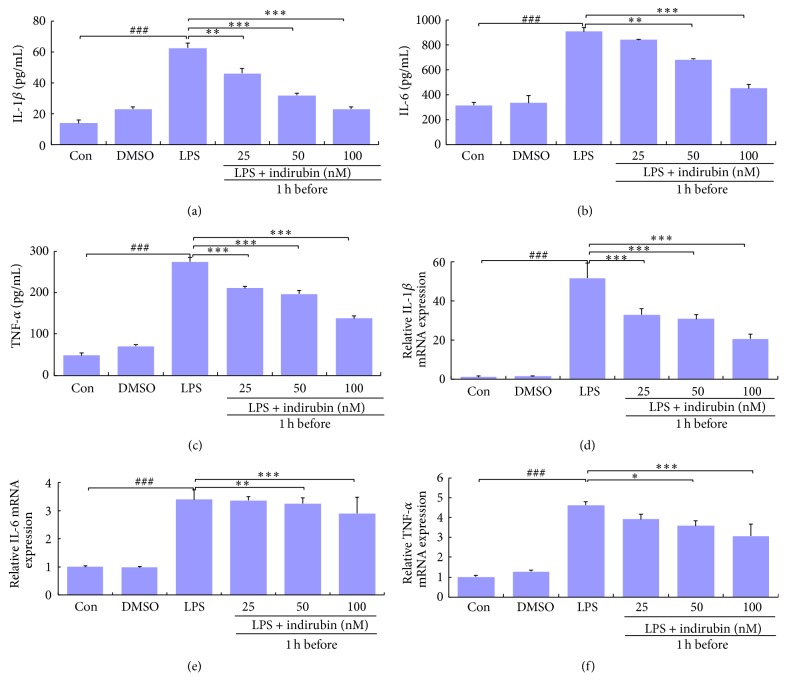
Figure 4.
Effects of indirubin on secretion of IL-1β, IL-6, and TNF-α by LPS-stimulated MMECs. The expressions for IL-1β (a, d), IL-6 (b, e), and TNF-α (c, f) were measured by ELISA (a–c) and qRT-PCR (d–f). Data are presented as means ± SEM (n = 3). ###p < 0.001 versus control group; ∗p < 0.05, ∗∗p < 0.01, and ∗∗∗p < 0.001 versus LPS group.

