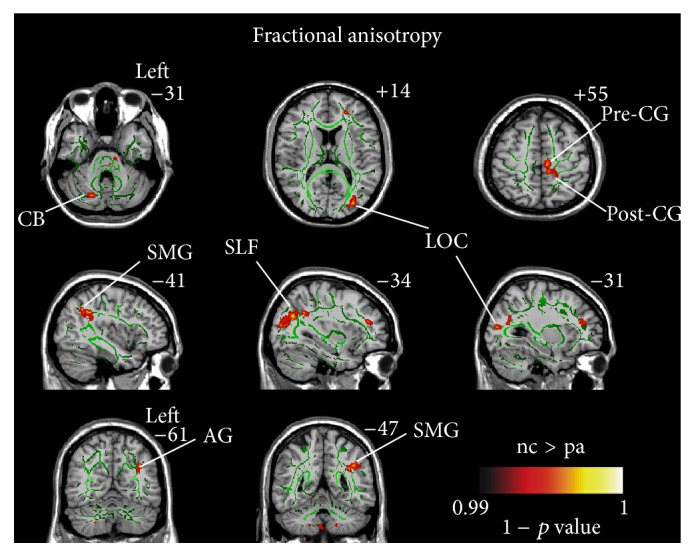
Figure 1.

Differences in fractional anisotropy (FA) between the SCI patients and healthy controls based on tract-based spatial statistics (TBSS) (p < 0.01, corrected using threshold-free cluster enhancement). Hot color represents 1 − p values. It is overlaid on the gyrus skeleton (green) and the MNI 152 template. Significant decreases in FA following SCI occurred in the left angular gyrus (AG), right cerebellar (CB), left precentral gyrus (PreCG), left lateral occipital region (LOC), left superior longitudinal fasciculus (SLF), left supramarginal gyrus (SMG), and left postcentral gyrus (PostCG).
