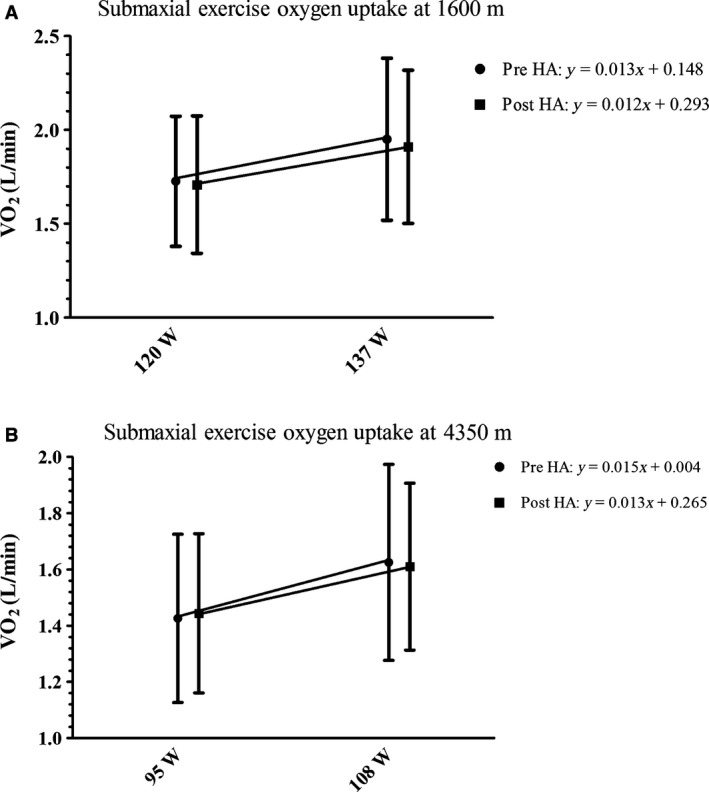
Figure 4.

Illustrates submaximal exercise oxygen uptake at two different exercise intensities (indicative of exercise economy) and the mean slope and y‐intercept (A) at 120 ± 30 W and 137 ± 35 W at 1600 m; and (B) at 95 ± 23 W and 108 ± 26 W at 4350 m was not different from pre to postheat acclimation (HA).
