Figure 5.

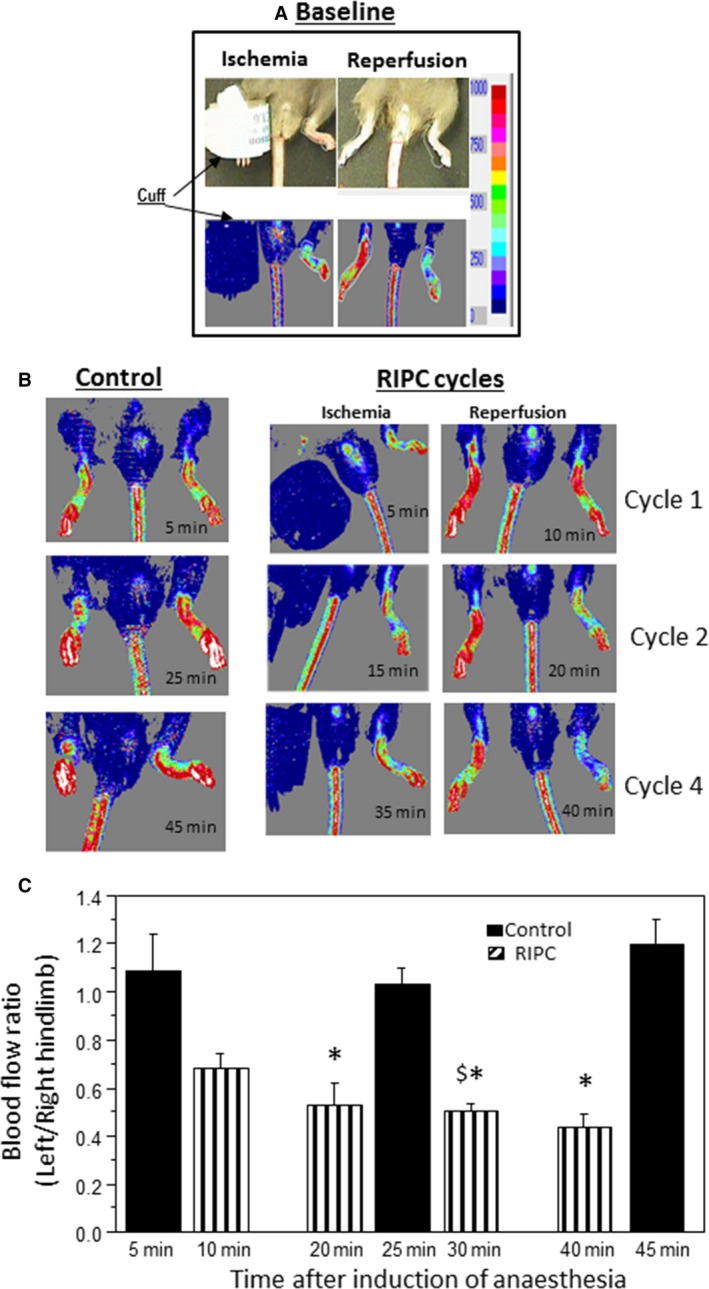
Blood flow ratio in hind limbs during remote ischemic preconditioning (RIPC) application. (A and B) Representative images showing changes of blood flow (color intensity) in both hind limbs of anesthetized mice. Top panel shows the flow during ischemia and following reperfusion (hyperemia). Lower left hand panel shows blood flow in anesthetized mouse overtime without application of RIPC. Lower right hand panel shows the changes in blood flow in limb exposed to four cycles of RIPC and the corresponding changes in its contralateral limb (white rectangles). (C) Changes in blood flow ratio expressed as left (uncuffed) limb over right in control mice or in mice exposed to RIPC application. Data extrapolated from color intensity (see colored panels above) and shown as mean ± SEM (n = 3 hearts for control and four for RIPC). Comparison was made between control and RIPC values at similar time points. *P < 0.05 versus corresponding control values. $ P < 0.05 versus Cycle 1 (10 min).
