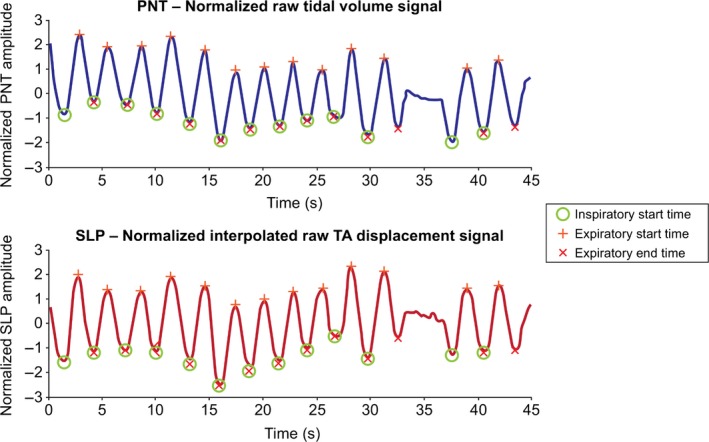
Figure 2.

A comparison between PNT and SLP traces with marked breaths. Data displayed are from a healthy 8‐year‐old female. Although different in detail, traces are similar in morphology. Both traces are normalized (zero mean, unit standard deviation) for ease of visual comparison. Neither traces were filtered. Inspiratory start times (green circle), expiratory start times (red plus sign), and expiratory end times (red cross) are identified. Abnormal (artifactual) breaths are manually excluded (e.g., the breath at 35 s). Note that there is a one‐to‐one correspondence between the identified breaths, that is, the nth breath on the PNT corresponds to the nth breath on the SLP trace. PNT, pneumotachography; s, seconds; SLP, structured light plethysmography; TA, thoraco–abdominal.
