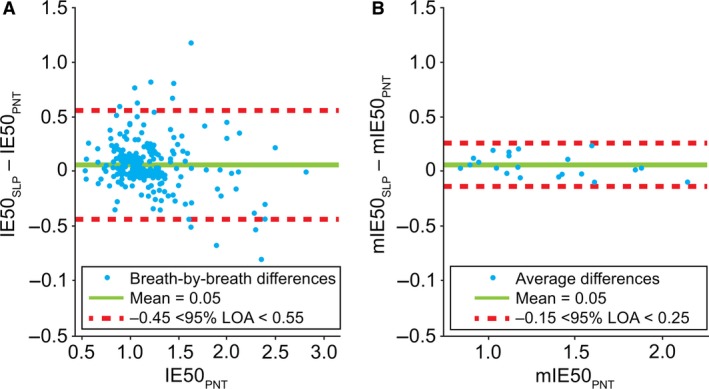
Figure 10.

Comparison of (A) breath‐by‐breath and (B) averaged* IE50 and IE50SLP. Note, a single point on the left graph is covered by the label. *Difference between the mean for each subject. IE50, inspiratory to expiratory flow ratio at 50% tidal volume (or SLP equivalent; IE50SLP); LOA, limits of agreement; m, mean; PNT, pneumotachography; SLP, structured light plethysmography.
