
Figure 2.
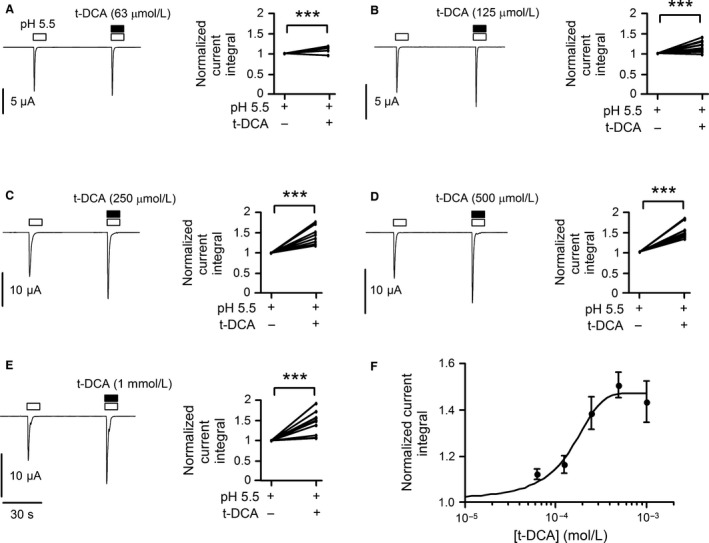
Concentration‐dependent potentiation of proton‐activated ASIC1a currents by t‐DCA. (A–E), Representative whole‐cell current traces recorded in human ASIC1a expressing oocytes exposed to pulses of pH 5.5 in the absence and presence of t‐DCA in concentrations as indicated; data from similar experiments are summarized to the right of each trace. Bath pH was 7.4 except for the time intervals indicated by open bars during which bath pH was switched to 5.5. Lines connect data points obtained in the same experiment. The current integral value of the 2nd response (with t‐DCA) was normalized to the current integral of the 1st response (without t‐DCA). (F), Concentration–response relationship of the stimulatory effect of t‐DCA on proton‐activated ASIC1a currents. Data (mean ± SE) from the same experiments as shown in A–E were fitted to equation (1) (n = 10; N = 2). ***P < 0.001; Student's t‐test.