
Figure 5.
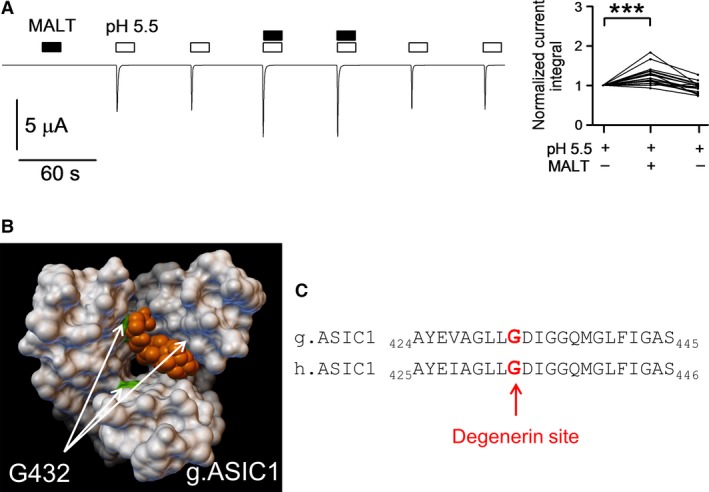
Molecular docking approach using the open state crystal structure of ASIC1 predicted binding of t‐DCA to the channel pore. (A), Representative whole‐cell current trace recorded in an oocyte expressing human ASIC1a. The oocyte was exposed to pH 5.5 and n‐dodecyl‐β‐D‐maltoside (MALT, 10 μmol/L) as indicated by open and black bars, respectively. Data from similar experiments are summarized to the right of the trace like in Figure 1B and D as normalized current integrals (n = 20; N = 3). (B), Molecular surface representation of the transmembrane domains of chicken ASIC1 (Baconguis et al. 2014) viewed from the extracellular side with a t‐DCA molecule (orange color) positioned at the site predicted by molecular docking approach. In the docking model shown the putative interaction site of t‐DCA corresponds to the site where maltoside was cocrystallized with ASIC1 (Jasti et al. 2007). The arrows indicate the position of glycine residue 432 (G432; highlighted in green) in each ASIC1a subunit. G432 is the amino acid residue with the highest contribution to the total energy of interaction between ASIC1 and t‐DCA. (C), Sequence alignment of chicken (g.ASIC1) and human (h.ASIC1a) corresponding to the first part of the TM2. The homologous amino acid residues G432 in g.ASIC1 and G433 in h.ASIC1a are indicated by bold characters highlighted in red.