
Figure 2.
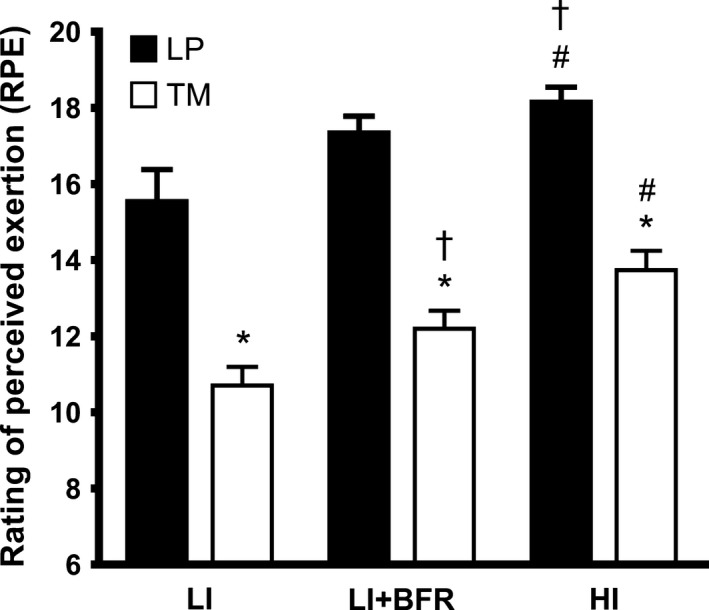
Ratings of perceived exertion (Borg scale) within LP and TM trials. Data are Mean ± SEM. *denotes different to LP (P < 0.05), †denotes different to LI (P < 0.05), #denotes different to LI and LI+BFR (P < 0.05).
Official websites use .gov
A
.gov website belongs to an official
government organization in the United States.
Secure .gov websites use HTTPS
A lock (
) or https:// means you've safely
connected to the .gov website. Share sensitive
information only on official, secure websites.
Ratings of perceived exertion (Borg scale) within LP and TM trials. Data are Mean ± SEM. *denotes different to LP (P < 0.05), †denotes different to LI (P < 0.05), #denotes different to LI and LI+BFR (P < 0.05).