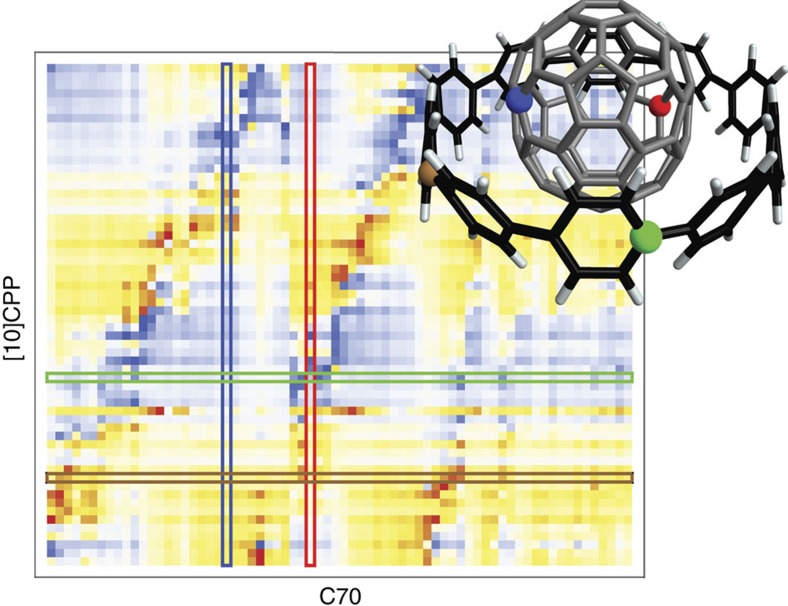
Figure 3. Heat map of the xy component of the interfragment non-local polarizability  in [10]CPP–C70.
Red and blue represent positive and negative values, respectively. Rows and columns correspond to carbon atoms of [10]CPP and C70, respectively, with four select carbon atoms color-coded to the marked atoms in the structure in the inset.

