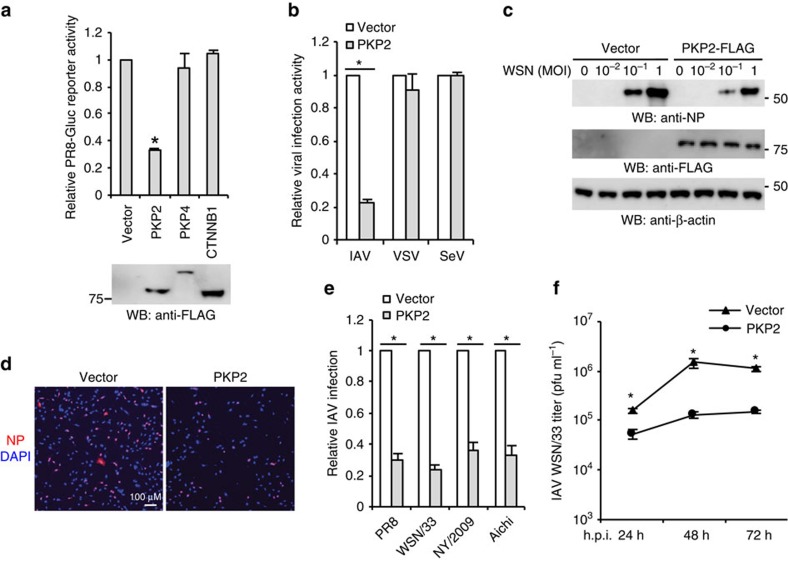
Figure 4. PKP2 restricts IAV infection.
(a) HEK293 cells were transfected with pCMV3-tag-8 vector, PKP2-FLAG, PKP4-FLAG or CTNNB1 (β-catenin)-FLAG for 24 h, followed by infection with 0.1 MOI of PR8-Gluc for 16 h. Luciferase activity assays were performed. All experiments were biologically repeated three times. Data represent means ±s.d. of three independent experiments. The P value was calculated (two-tailed Student's t-test) by comparison with the vector control. An asterisk indicates P<0.05. Western blot shows the protein expression levels from one experiment. (b) HEK293 cells transfected with PKP2-FLAG or pCMV3-tag-8 vector were infected with 0.1 MOI of IAV-Gluc, VSV-Luc and SeV-Luc for 16 h. Data represent means ±s.d. of three independent experiments. The P value was calculated (two-tailed Student's t-test) by comparison with the vector control. An asterisk indicates P<0.05. (c) HEK293 cells were transfected with pCMV3-tag-8 vector or PKP2-FLAG for 24 h, then infected with WSN/33 IAV for 16 h. Cell lysates were blotted using the indicated antibodies. (d) HEK293 cells were transfected with pCMV3-tag-8 vector or PKP2-FLAG for 24 h, then infected with WSN/33 IAV for 16 h. Fixed cells were stained with an anti-NP antibody. The percentage of stained cells is summarized in e. (e) HEK293 cells were transfected with the pCMV3-tag-8 vector or PKP2-FLAG for 24 h, then infected with 1 MOI of PR8, WSN/33, NY/2009 or Aichi IAV for 16 h. Fixed cells were stained with anti-NP antibody (PR8 and WSN/33), anti-HA (NY/2009) or anti-Aichi antibodies. The relative infection was determined by the ratio of positive cells. Data represent means ±s.d. of three independent experiments (>80 cells counted per experiment). The P value was calculated (two-tailed Student's t-test) by comparison with the pCMV3-tag-8 vector control. An asterisk indicates P<0.05. (f) A549 cells were transfected with PKP2-FLAG. After 48 h, cells were infected with 0.001 MOI of WSN/33 IAV. After the designated hour post infection (h.p.i.), virus titers were determined by plaque assay. All experiments were biologically repeated three times. Data represent means ±s.d. of three independent experiments. The P value was calculated (two-tailed Student's t-test) by comparison with the pCMV3-tag-8 vector control. An asterisk indicates P< 0.05.

