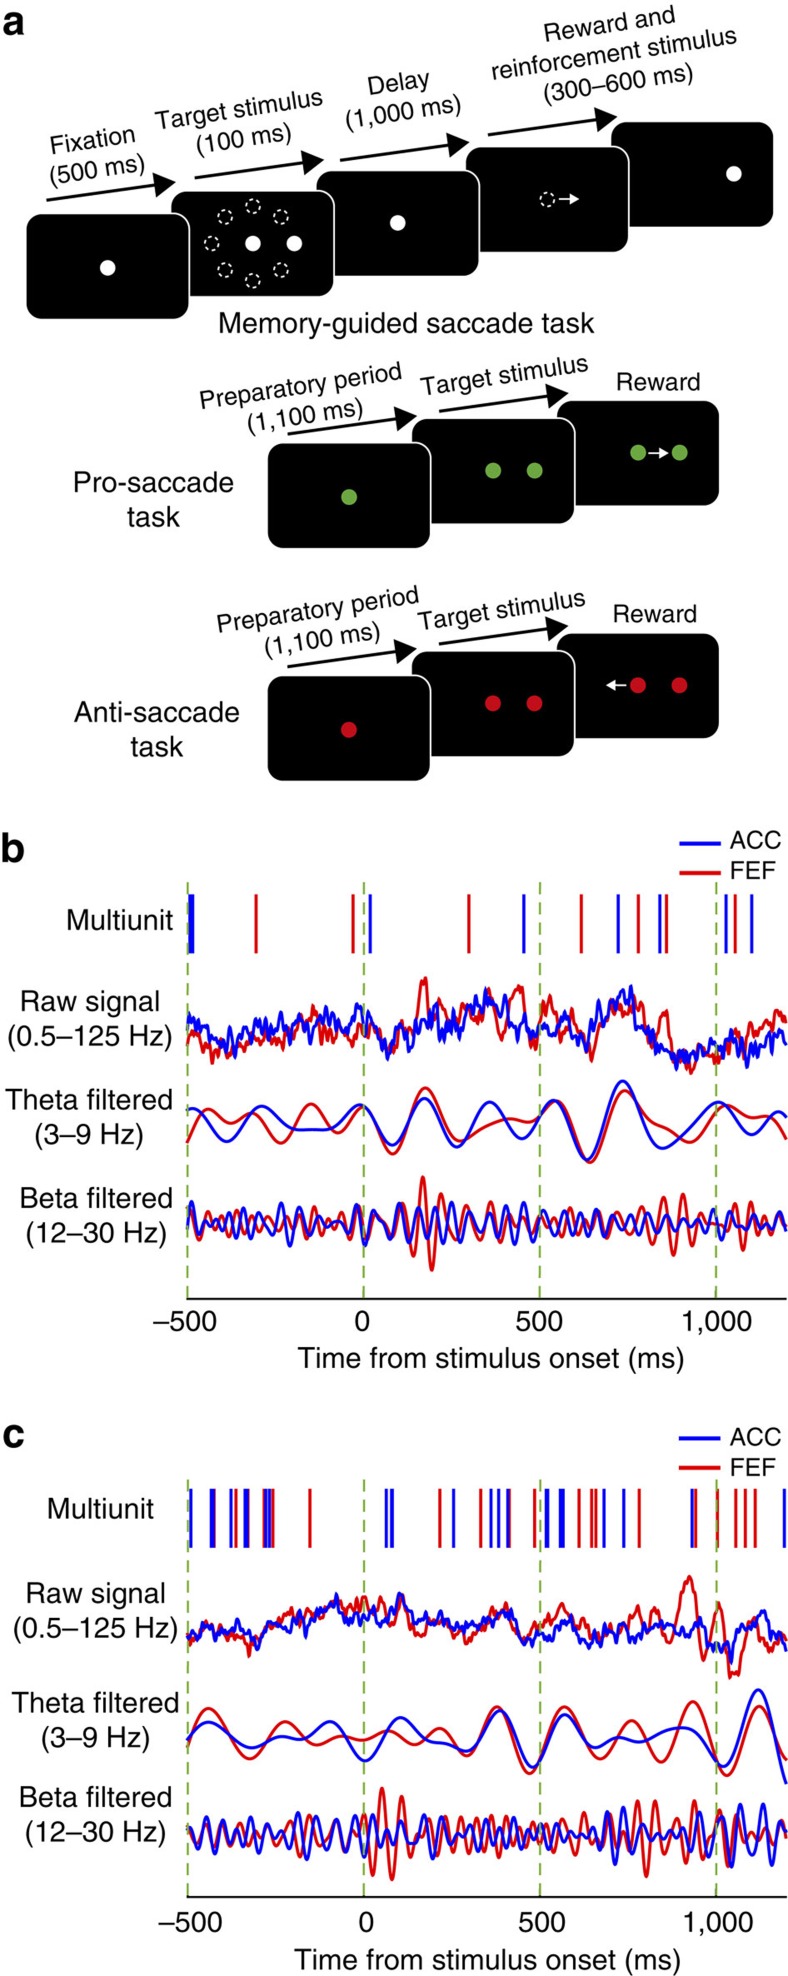
Figure 1. Experimental paradigm and sample traces of simultaneously recorded activity in ACC and FEF.
(a) Schematic of the memory-guided saccade task and pro-/anti-saccade task. (b) The traces show the multiunit activity, raw LFP signal (0.5–125 Hz), theta band-pass-filtered signal (3–9 Hz), and beta band-pass-filtered signal (12–30 Hz) in a trial of memory-guided saccade task. (c) Same as in a in another memory-guided saccade task trial. The vertical green dashed lines indicate the 500 ms time intervals aligned on stimulus onset.

