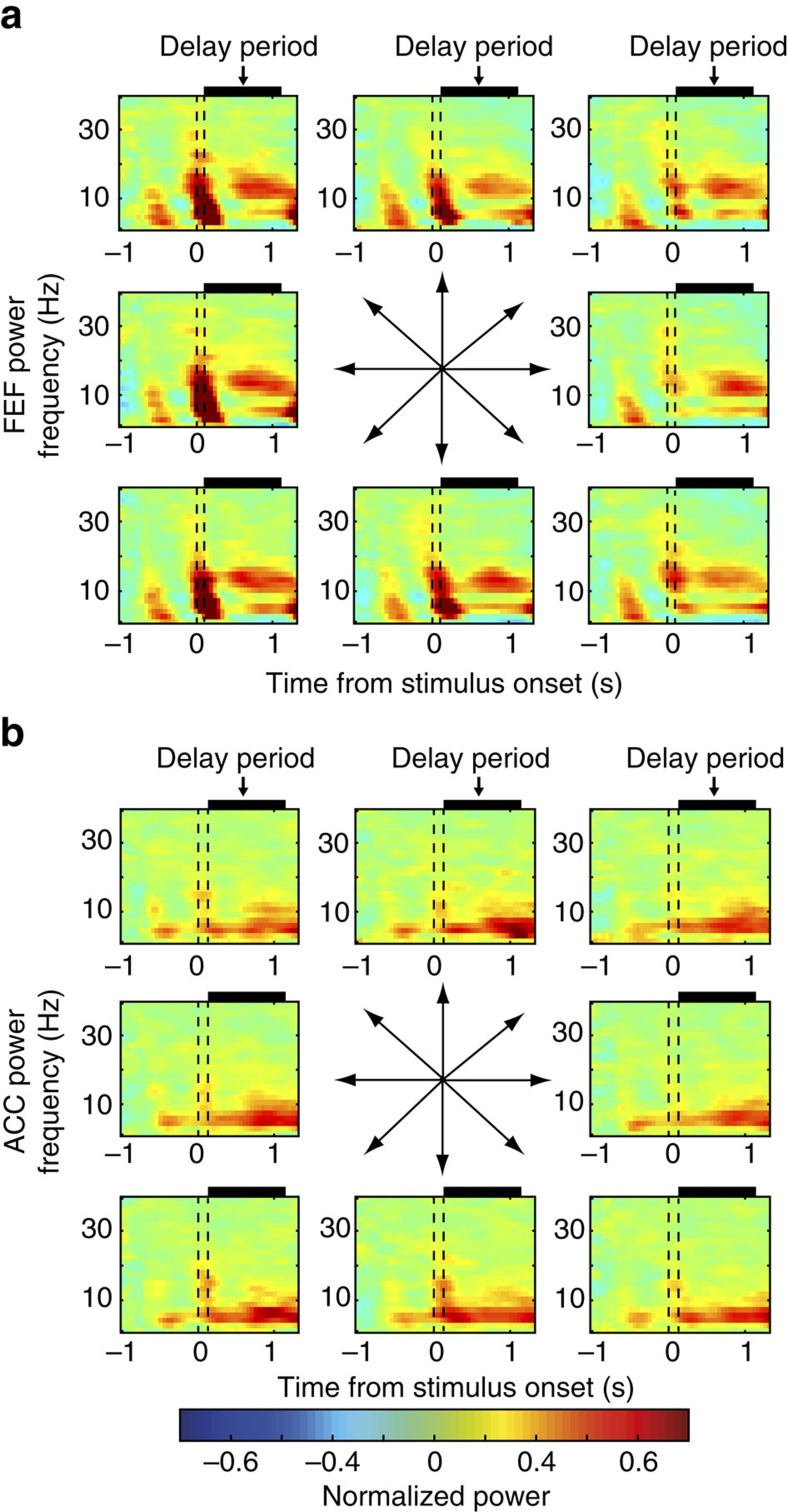
Figure 2. LFP power in FEF and ACC during the memory-guided saccade task.
(a) Average time-frequency spectra of the FEF LFP power across eight target locations in the memory-guided saccade task. (b) Average time frequency spectra of ACC LFP power across eight target locations in the memory-guided saccade task. The dashed lines demarcate the time of the onset and offset of the target stimulus. The black boxes on top of each graph demarcate the delay period.

