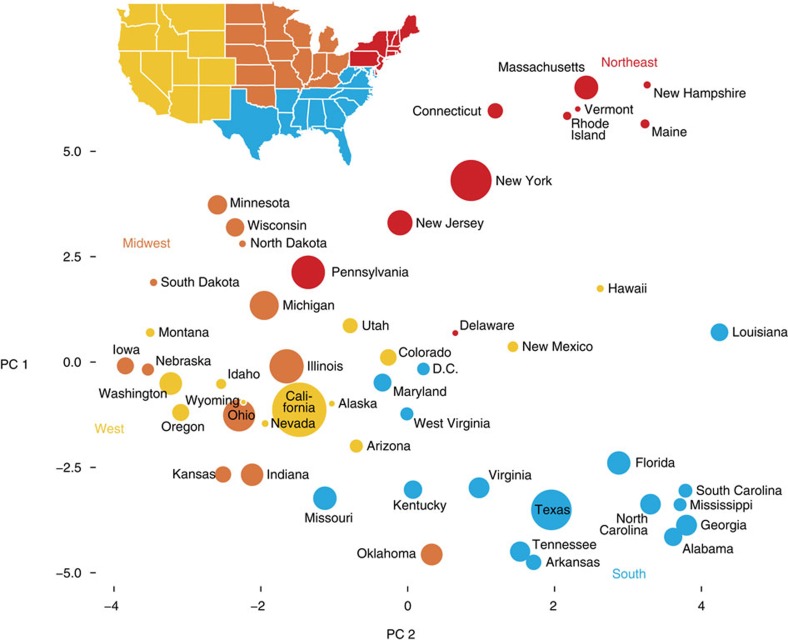
Figure 1. Two-dimensional projection of US states based on cross-state IBD.
Principal components (PCs) are computed using kernel PCA, in which the kernel matrix is defined by total IBD between pairs of states, normalized to remove the effect of variation in within-state IBD. US states that share high levels of IBD on average are placed closer to each other in the projection onto the first two principal components. The area of each circle is scaled by number of self-reported birth locations in the state (Supplementary Fig. 1). US states are coloured by geographic region (Northeast, South, Midwest and West). Maps were generated with the maps R package using data from the Natural Earth Project (1:50 m world map, version 2.0). These data are made available in the public domain (Creative Commons CC0).

