
Figure 2. Partial 2D multiplicity-edited HSQC NMR correlation map of aqueous extract obtained from the Tm5 cell line with the principal assignments.
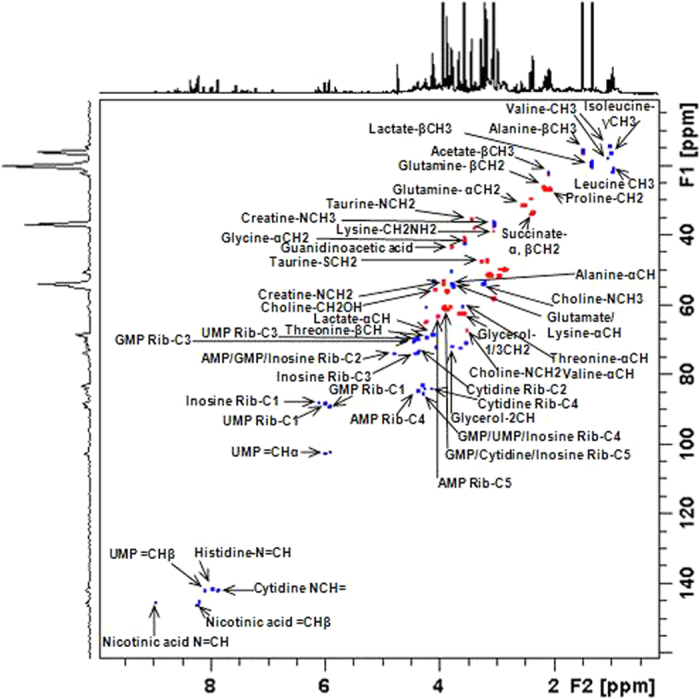
The positive phase (blue) corresponds to CH and CH3 correlations, and the negative phase (red) corresponds to CH2 correlations.