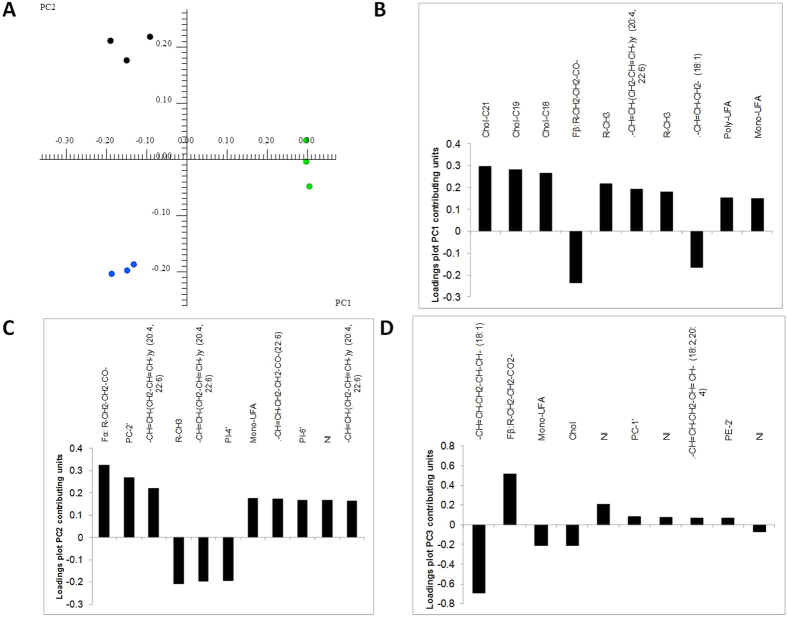
Figure 6.
(A) Scores plot (PC1 vs PC2) of the PCA analysis performed with the 1H NMR spectra of lipid extracts of mouse cell line Melan-a (under the three different growth conditions, namely MA (black), MA-24 (blue) and MA-72 (green); (B) Loadings plot contributing units of main metabolites for PC1; (C) Loadings plot contributing units of main metabolites for PC2; (D) Loadings plot contributing units of main metabolites for PC3. NI – Not identified.

