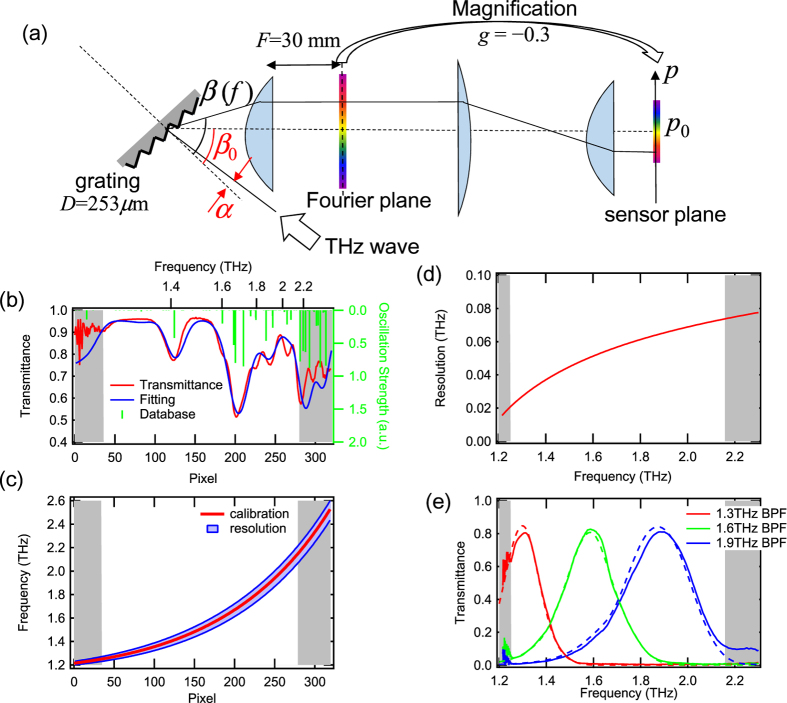
Figure 3. Calibration of the frequency from the pixels.
(a) The geometrical relationship between the diffraction angle β(f) and the focused position p(f). Other geometrical parameters are also defined. (b) Transmission spectra of water vapor in air. The red curve is the result from the multi-channel spectrometer, the blue curve is the fit with the database, and the green curve is the absorption line in the database. The shadows on both sides show the region that is unreliable due to the scarcity of signals. (c) The calibration curve from pixel space to frequency space in the spectrometer. The light blue area shows the frequency resolution. (d) The frequency-dependent frequency resolution, which corresponds to the width of the blue area in (c). (e) The transmission spectra of the bandpass filters obtained using the multi-channel spectrometer (solid) and TDS (dashed). The TDS spectra are convolved with the frequency resolution shown in (d).

