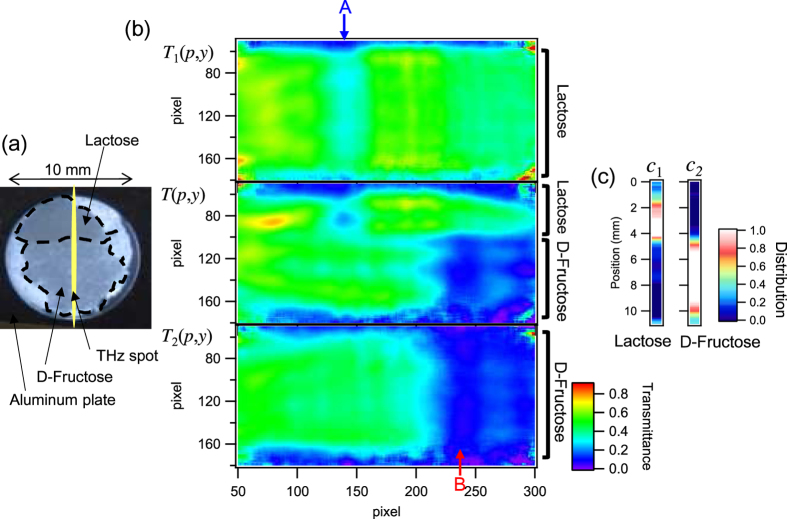
Figure 6. Results of the spectroscopic imaging and the independent component analysis.
(a) Optical image of the test sample with the lactose and D-fructose domains. (b) Transmittance image of the test sample (middle), and the counterparts for the pure lactose (top) and D-fructose (bottom) samples, respectively. The absorption lines shown in Fig. 4 are again indicated with arrows and characters (A and B). (c) The distribution of each component obtained from the analysis.

