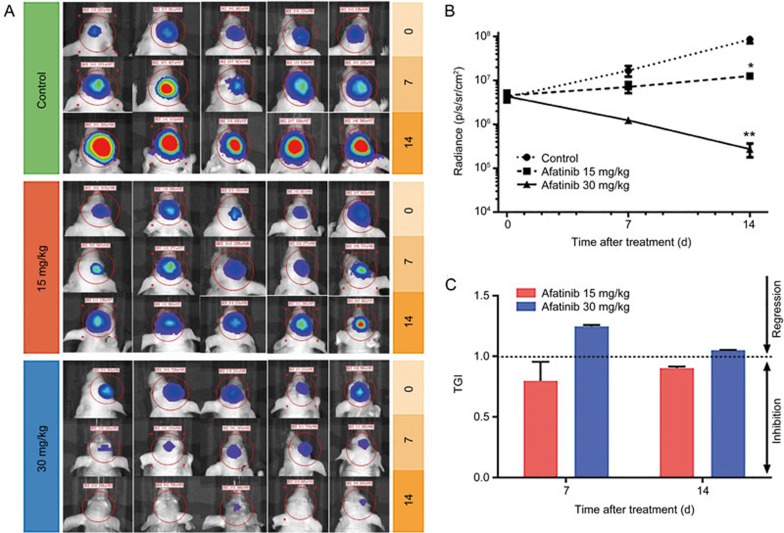
Figure 2.
Effects of different doses of afatinib on BMs in mice. (A) Bioluminescence imaging of mice bearing brain metastases on d 0, 7, 14 after treatment with the different doses of afatinib and the vehicle control. (B) Mean radiance versus time by treatment in mice exhibiting brain metastases. Treatment was initiated on d 0 (n=5/time point/group). (C) Tumor growth inhibitory rate of low and high dose administration of afatinib at different time points. Mean±SEM.

