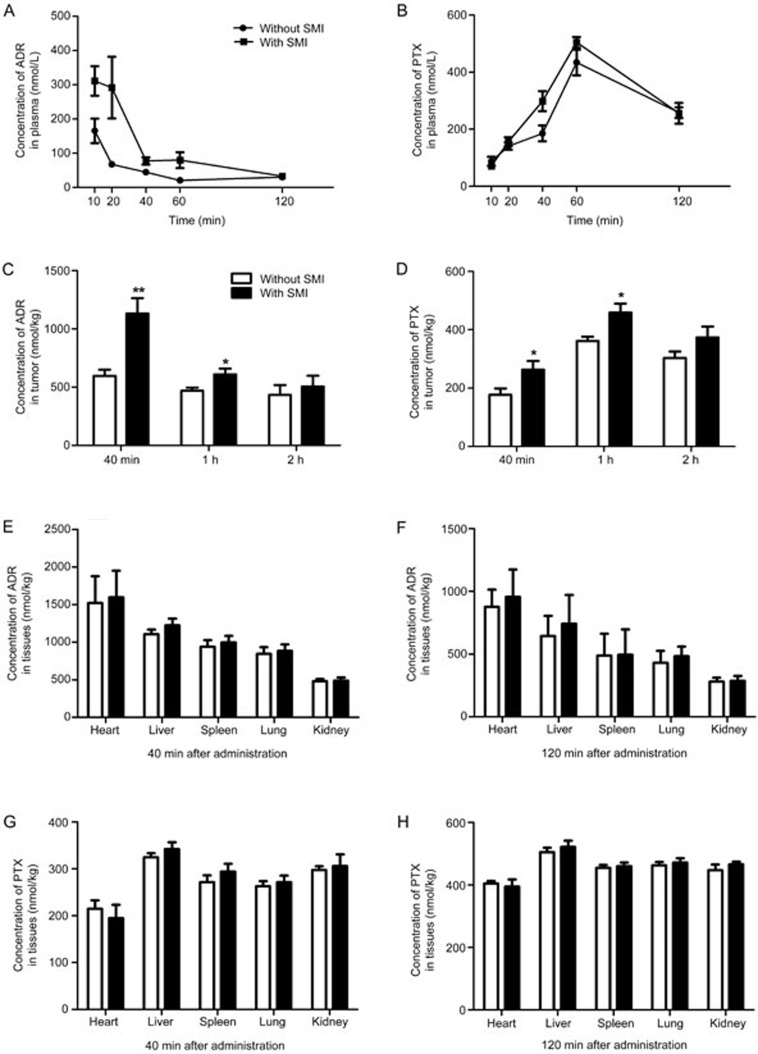
Figure 3.
Effects of SMI on the ADR or PTX concentration in plasma, tumors, and non-malignant tissues of LoVo colon cancer xenograft mice. (A, B) Concentration-time curves of ADR or PTX in xenograft mice plasma. (C, D) Concentration of ADR or PTX in tumors. (E–H) Concentration of ADR or PTX in non-malignant tissues of xenograft mice. *P<0.05, **P<0.01 vs without SMI. n=7–10.

