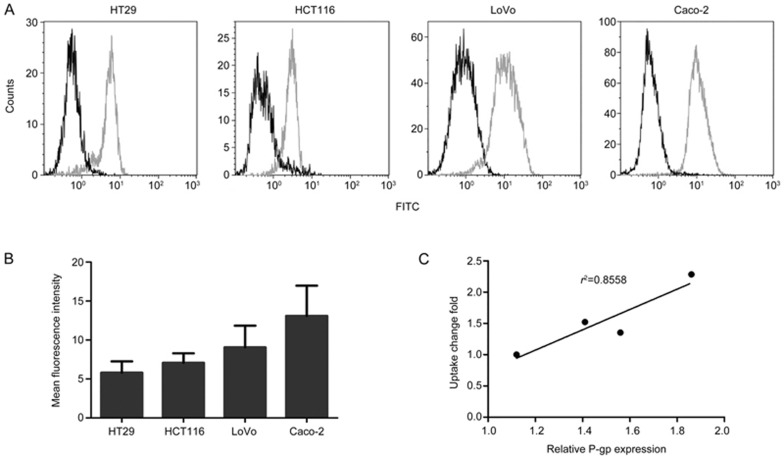
Figure 6.
P-gp expression in four colon cancer cell lines and the correlation between SMI-induced changes in intracellular ADR accumulation and P-gp expression. (A) Detection of P-gp expression by flow cytometry. Green: FITC-P-gp and black: isotype control. (B) Mean fluorescence intensity of each cell line. (C) The correlation between SMI-induced changes in intracellular ADR accumulation and P-gp expression.

