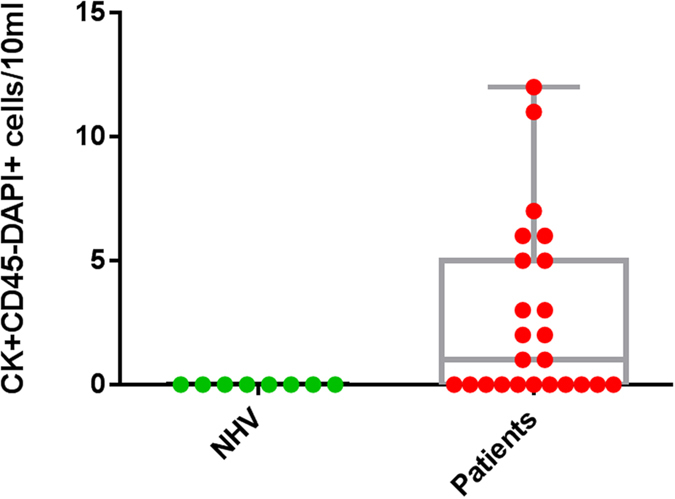
Figure 5. Box plot summary indicating the range of CTCs (pan-CK + CD45-DAPI + ) cells/10 ml.

The box plot presents the median and all individual data points. NHV; normal healthy volunteers.

The box plot presents the median and all individual data points. NHV; normal healthy volunteers.