
Figure 5. Box plot summary indicating the range of CTCs (pan-CK + CD45-DAPI + ) cells/10 ml.
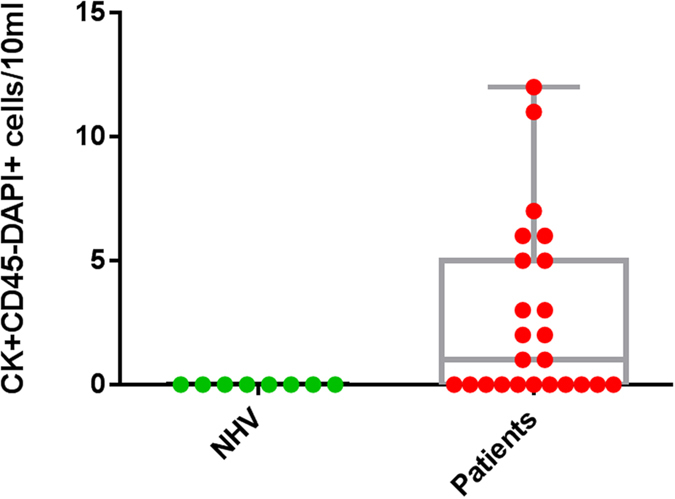
The box plot presents the median and all individual data points. NHV; normal healthy volunteers.
Official websites use .gov
A
.gov website belongs to an official
government organization in the United States.
Secure .gov websites use HTTPS
A lock (
) or https:// means you've safely
connected to the .gov website. Share sensitive
information only on official, secure websites.
The box plot presents the median and all individual data points. NHV; normal healthy volunteers.