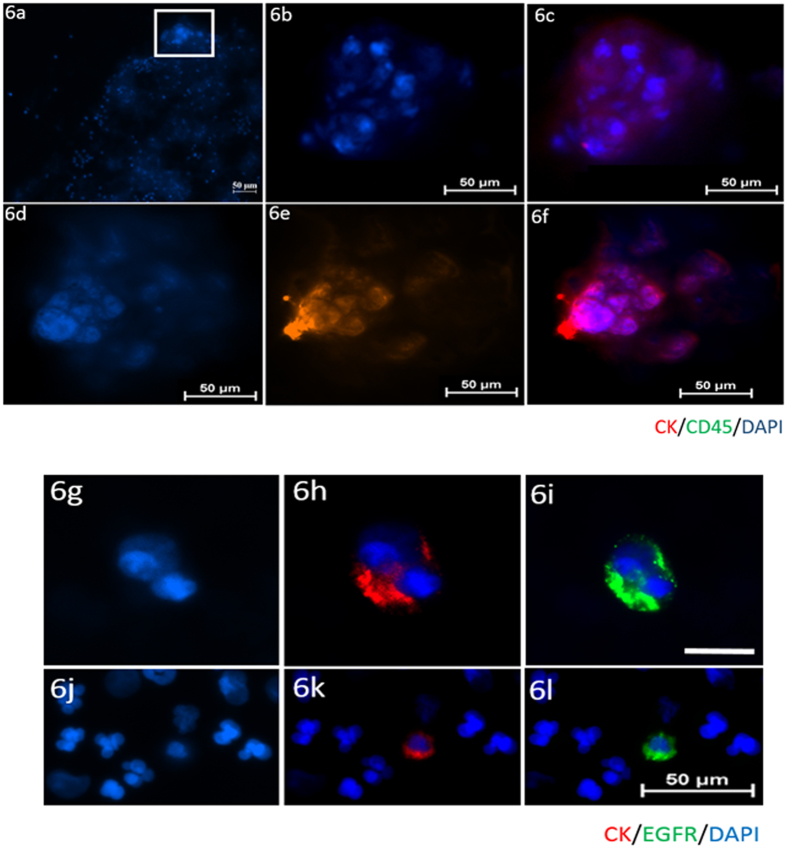
Figure 6. Patient “micro_01, micro_06”; CTC clusters detected in the blood.
(a) 100x magnification showing the CTC cluster in the top of the cytospot. 1000x images of (b) DAPI (c) Cytokeratin/DAPI composite (d) DAPI (e) Cytokeratin (f) Cytokeratin/DAPI composite. Scale bar represents 50 μm. Figure 6 continued. Patient “micro_12”; CTC doublet detected in blood. (g) DAPI (h) Cytokeratin/DAPI composite (i) EGFR/DAPI composite. Patient “micro_03” single CTCs detected in blood. (j) DAPI (k) Cytokeratin/DAPI composite (l) EGFR/DAPI composite. Scale bar 10 μm (g–i). Scale bar 50 μm (j–l).

