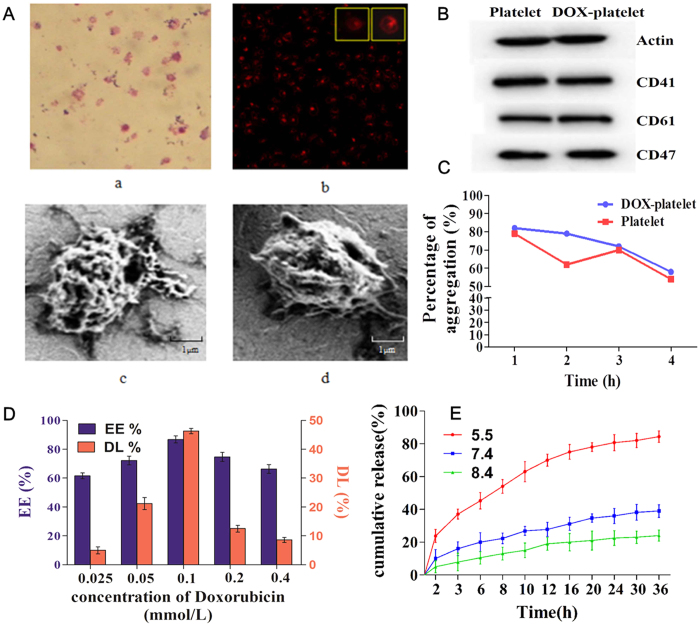
Figure 2.
(A) a Image of platelets under oil immersion lens (400× ); b Image of platelets with 0.1 mmol/L DOX under fluorescence microscope (400×); c image of platelets under SEM; d image of platelets with o.1 mmol/L DOX under SEM. (B) Representative protein bands of platelets in western blotting. (C) Collagen-induced aggregation pattern of washed platelet and DOX-platelet at different time interval. (D) EE and DL of DOX-platelet with different incubation concentrations of DOX (0.025 mmol/L, 0.05 mmol/L, 0.1 mmol/L, 0.2 mmol/L, 0.4 mmol/L). (E) In vitro DOX release behaviors in PBS with different pH values (5.5, 7.4 and 8.4) at 37 °C respectively.

