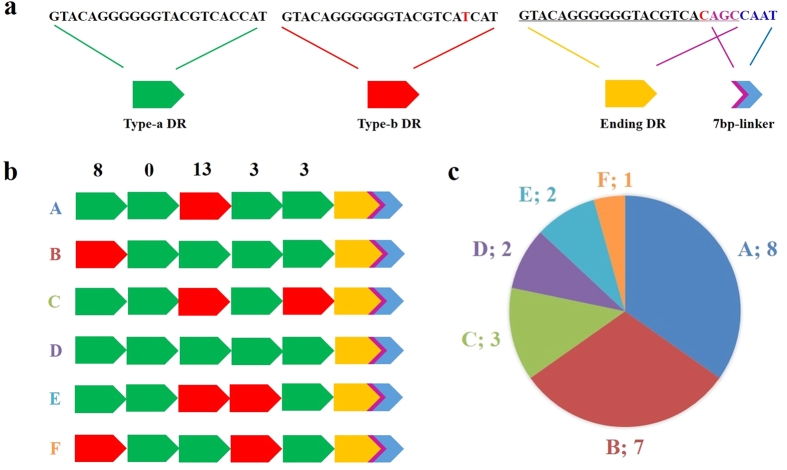
Figure 7. Different structures, combinations and appearance rates of DR regions in AGV2.
(a) Nucleotide sequences of the three types of DR. Type-a DR is covered by green; Type-b DR is covered by red and has a substitute at the 19th base of Type-a DR highlighted in red; Ending DR is covered by yellow, with the nucleotide sequence underlined; the 7-bp linker is partially covered by blue; and other overlapping with the Ending DR is covered by violet. (b) Different combinations of DR region. The graphics represent different DRs, as described in (a). Each combination was grouped as A, B, C, D, E, or F and was differently coloured. Type-b DR as each component of the DR combination is displayed above the component column. (c) Proportion of each group of DR combinations. The number of each group is shown in the pie chart.

