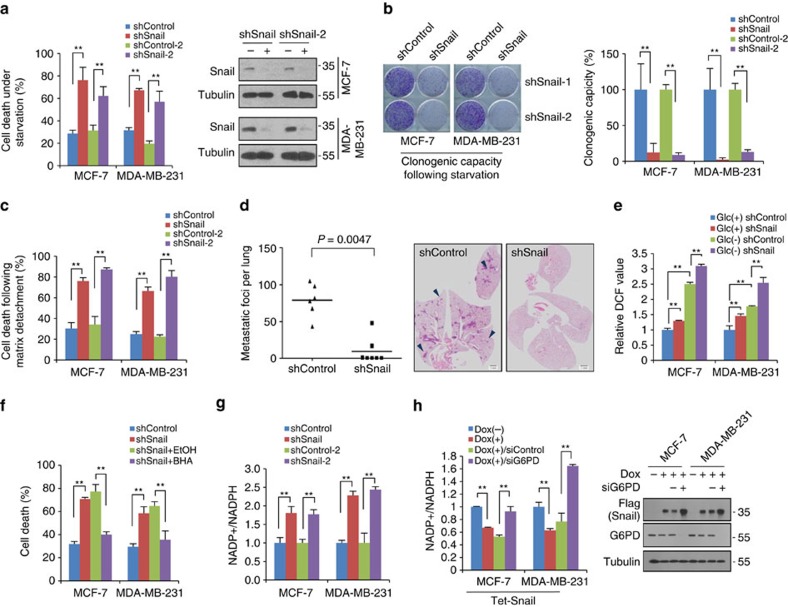
Figure 1. Snail potentiates cancer cell survival under starvation via overcoming oxidative stress.
(a) Cells were cultured in absence of glucose, and cell death was quantitated by trypan blue exclusion assay (left). Immunoblot analysis shows endogenous Snail protein abundance (right). In total, 20 μg of cell lysates were used to detect endogenous Snail, and loading controls were validated from reprobing the same blot. Antibody validations for immunoblot analysis are provided in Supplementary Fig. 10. (b) Clonogenic survival assay of cancer cells following glucose starvation as described in ‘Methods' section (left). Colonies of more than 50 cells were counted after crystal violet staining (right). (c) Cell death of breast cancer cells expressing control-shRNA or Snail-shRNA cultured 24 h after plating in attached or detached (poly-HEMA-coated) plates. (d) Lung metastasis by tail vein xenograft of MDA-MB-231-D3H2LN cells. In total, 5 × 10⁵ cells either of control (shControl, n=6) or of knockdown of Snail (shSnail, n=7) were inoculated intravenously into immunodeficient mice. The number of lung metastatic nodules at day 28 was counted under microscopic examination (left). Statistical significance was determined by Mann–Whitney test. Whole-field images of representative lungs that showed median value for each group (right). Arrows indicate metastatic tumour foci in mouse lung. Scale bar, 1 mm. (e) The cancer cells expressing control-shRNA or Snail-shRNA were incubated in the presence of glucose (Glc+) or absence (Glc−) for 2 h. The ROS levels are expressed as the relative change in the mean DCF values relative to the glucose-treated control shRNA. (f) Antioxidant BHA (100 μM) treatment rescued cell death induced by glucose deprivation of Snail knock-downed cells. (g) The effect of Snail knockdown on NADP+/NADPH ratio in cancer cells. (h) Inducible Snail overexpression increased NADPH production in a G6PD-dependent manner. Snail was induced by treatment of doxycycline (Dox) for 48 h in combination with control or G6PD siRNA. NADP+/NADPH ratio (left) and protein abundance (right) were determined. In total, 5 μg of cell lysates were used to detect overexpressed flag-tagged Snail and endogenous G6PD, and loading controls were validated from reprobing the same blot. Data are means±s.d. from n=3 (a–c) or n=5 (e–h) independent experiments. Statistical significances compared with control were denoted as *P<0.05; **P<0.01 by a two-tailed Student's t-test. Unprocessed original scans of blots are shown in Supplementary Fig. 12.

