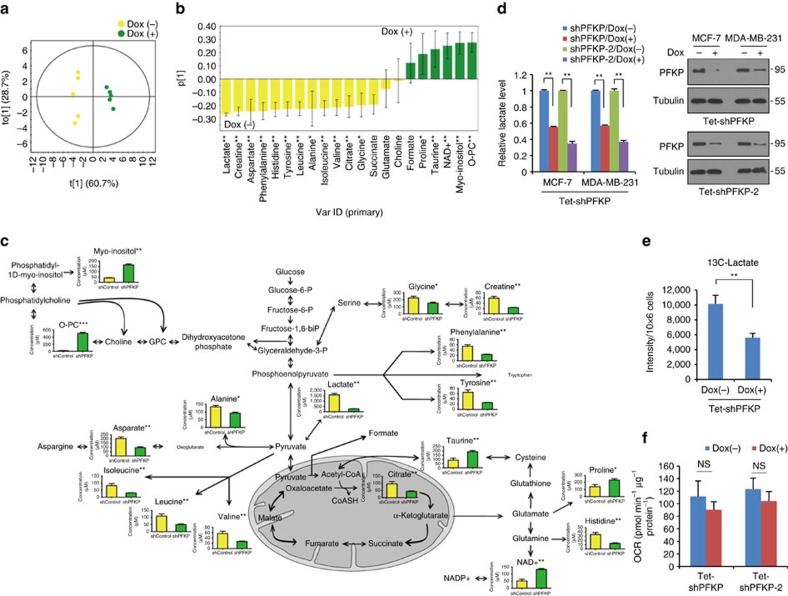
Figure 4. PFKP is the gate controller of glucose flux into glycolysis.
(a,b) Metabolic profile of NMR spectra following inducible knockdown of PFKP in MDA-MB-231 cells. OPLS-DA score plot (R2X=0.893, R2Y=0.985, Q2=0.977) (a) and loading column plot (b) of metabolite concentrations through targeted profiling derived from 1H NMR spectra of MDA-MB-231 cell extracts treated with control shRNA (Dox−) and PFKP shRNA (Dox+). (c) A diagram and quantification of the changes in intracellular metabolites following inducible knockdown of PFKP in MDA-MB-231 cells. *,** and *** indicates P<0.05, P<0.01 and P<0.001 calculated from Mann–Whitney U test. NAD+, nicotinamide adenine dinucleotide (oxidized form); O-PC, O-phosphocholine. The x and y axis represent experimental groups (yellow bars, shControl; green bars, shPFKP) and metabolite concentration (μM), respectively. (d) Relative lactate level following doxycycline-inducible PFKP shRNA (Dox+) in breast cancer cells (left). Immunoblot analysis shows PFKP protein abundance in two independent sets of shRNA against PFKP (right). In total, 5 μg of cell lysates were used to detect endogenous PFKP, and loading controls were validated from reprobing the same blot. The image is representative of two independent experiments. (e) The relative abundance of 13C-lactate from the 13C-glucose tracer experiment in MDA-MB-231 cells. (f) Mitochondrial OCR (delta OCR pre- and post- rotenone) in Tet-inducible PFKP shRNA. Data are means±s.d. from n=3 (d) or n=5 (e,f) independent experiments. Statistical significances compared with control are denoted as *P<0.05; **P<0.01 by a two-tailed Student's t-test. Experiment (d) is representative and was replicated from at least two independent experiments.

