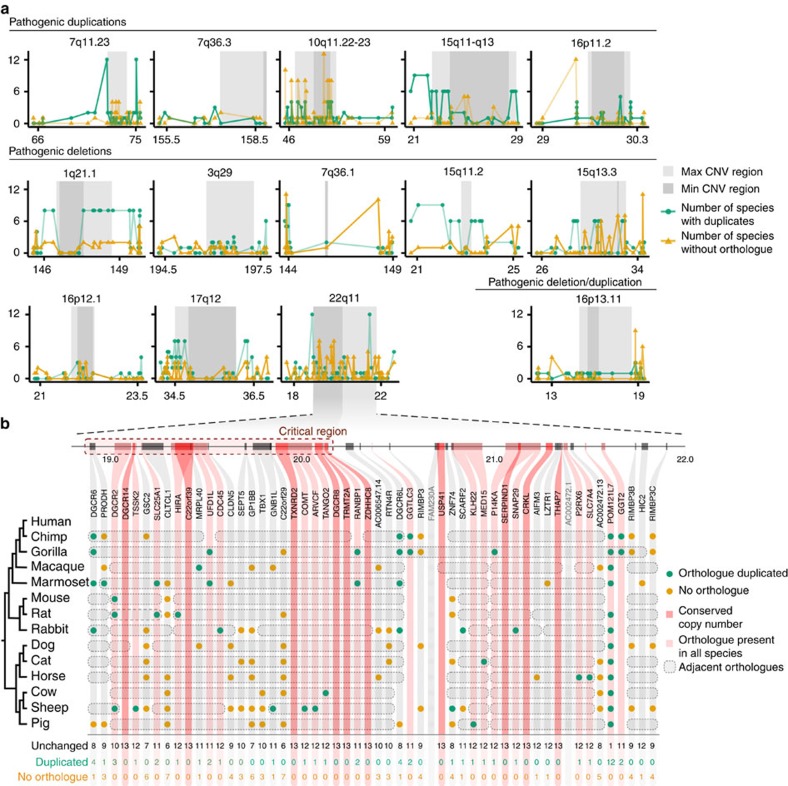
Figure 3. Mammalian copy number changes for genes within known pathogenic CNVRs.
(a) Copy number changes across mammalian species for genes within known pathogenic CNVRs associated with schizophrenia and other neurodevelopmental disorders obtained from ref. 36. The minimal (min) CNVR (shaded dark grey) is typically the smallest region associated with the disease phenotype, while the maximal (max) CNVR (shaded light grey) is typically observed. Ten flanking genes on each side are also plotted where possible. Each region is labelled above with the chromosomal band and position along chromosome in megabases is shown on the x axis. Genes are plotted by start position. Each point represents for one human gene the number of duplications (green) and losses (orange). Genes within regions are listed in Supplementary Data 6. (b) For each protein-coding gene within the 22q11 region, copy number changes across 13 mammalian species are shown. Green circles indicate where orthologues are duplicated, orange circles where orthologues are missing. Genes highlighted in light red are genes where at least one orthologue is present in all species and genes highlighted in dark red are genes with conserved one-to-one orthology across the mammalian species tested (completely conserved genes). Grey dashed outlines group orthologues that are neighbouring on their respective chromosome/scaffold in each species. Genes with greyed-out names were not included in copy number analysis and so no data are displayed for them.

