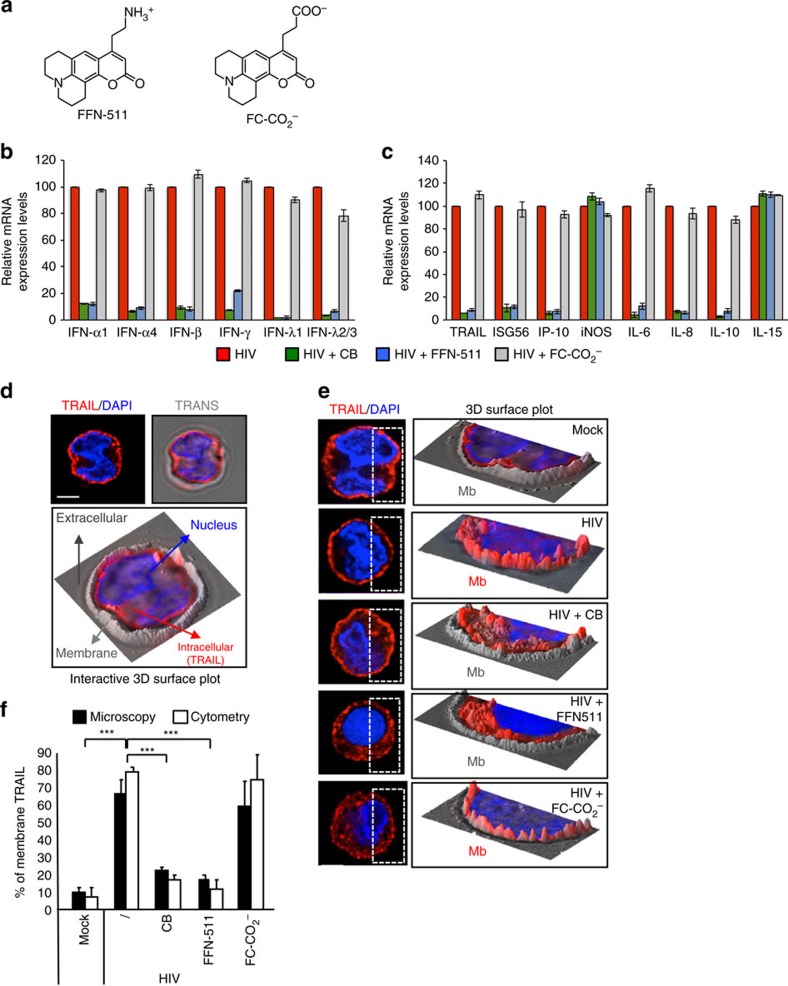
Figure 4. The NH3+ function is essential for inhibitory effect on pDC.
(a) Chemical structures of FFN-511 and FC-CO2−. (b,c) mRNA levels of IFN-(α, β, γ, λ1, λ2/3) (b) ISG56, IP-10, iNOS and IL-(6, 8, 10, 15) (c) from purified pDC pre-incubated with CB, FFN-511 or FC-CO2− (10 μM) and stimulated overnight with HIV, were measured by RT-qPCR and normalized to RPL13A. (d) Study of TRAIL expression by three dimensions (3D) microscopy (left panel) and 3D interactive surface plot of pDC using bright light (right panel). Cell is stained with DAPI (blue) and TRAIL (red). Plasma membrane is in grey relief. Scale bar, 3 μm. (e) Epifluorescence at three dimensions (3D) microscopy (left panels) of purified pDC after pre-incubation with CB, FFN-511 or FC-CO2− (10 μM) and overnight stimulation with HIV. Cells were then stained with anti-TRAIL (red) and mounted with Fluoromount G with DAPI (blue). Scale bar, 3 μm. 3D interactive surface plot (right panels) were then acquired after ImageJ analysis. (f) Comparison between the 3D microscopy and flow cytometry method to quantify the percentage of membrane TRAIL of pDC after the different stimulations. Data shown as the means of three independent experiments±s.e.m. P values (p) were determined using a two-tailed Student's t test. ***P<0.001, **P<0.01, *P<0.05.

