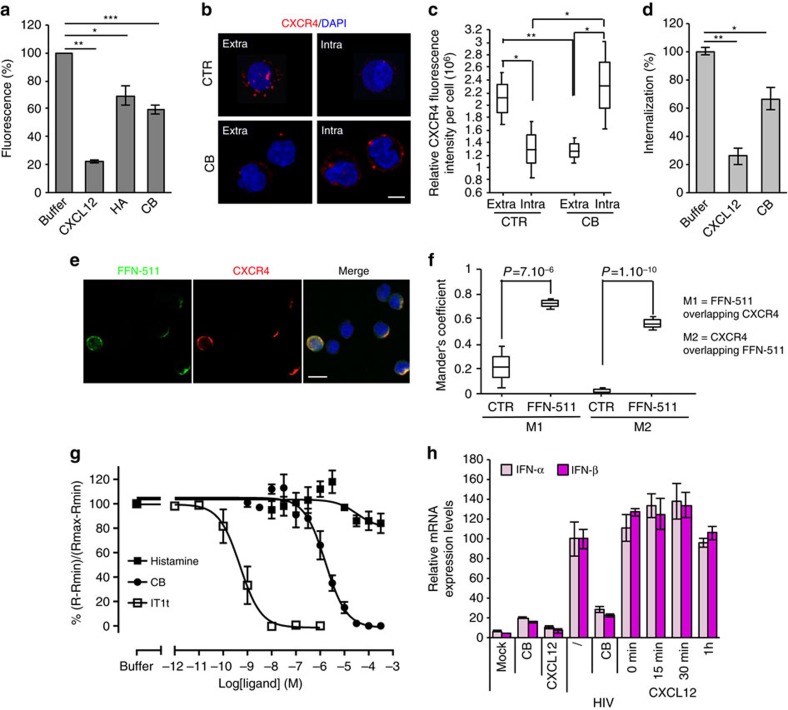
Figure 5. The inhibitory effect of amines on pDC requires the binding to CXCR4.
(a) Jurkat cells were incubated with CXCL12 (100 nM), HA or CB (1 mM) at 4 °C for 30 min before staining with 12G5 antibody (anti-CXCR4) to assess compound fixation on CXCR4 by flow cytometry. (b) Confocal microscopy of purified pDC was performed to assess the internalization of CXCR4. Cells were incubated with 12G5 antibody at 4 °C before treatment with CB. The cells were stained with secondary antibody before or after being fixed and permeabilized, to observe extracellular or intracellular CXCR4 expression respectively. Cells were mounted with Fluoromount G with DAPI (blue). Scale bar, 7 μm. (c) Quantification of the intensity of fluorescence of 15 purified pDC after treatment or not. (d) Jurkat cells were incubated with CXCL12 (250 nM) or CB (10 μM) at 37 °C for 30 min before being stained with 1D9 antibody (anti-CXCR4) to assess internalization of CXCR4 by the compounds by flow cytometry. (e) Confocal microscopy of purified pDC after pre-incubation with FFN-511 (green). Cells were then stained with anti-CXCR4 (12G5) (red) and mounted with Fluoromount G with DAPI (blue). Scale bar, 12 μm. (f) Quantification of the colocalization between CXCR4 and FFN-511 in the cytoplasm of 20 purified pDC. Mander's Coefficient was obtained after analysis by JACoP pluging in ImageJ. M1 represents FFN-511 overlapping CXCR4 and M2 represents CXCR4 overlapping FFN-511. (g) Affinity of ligands for CXCR4 receptor were evaluated with the Tag-lite assay on HALOtag-CXCR4 receptors. Cells expressing HALO-tag CXCR4 were incubated with HALOtag- Lumi4-Tb (100 nM) for 1 h, then incubated in the presence of CXCL12-red tracer (5 nM) and increasing concentration of competitors. FRET signal were measured after overnight incubation at 4 °C (ref. 65). (h) mRNA levels of IFN-α/β from purified pDC pre-incubated with CB (10 μM) or CXCL12 (62.5 nM) for different times and stimulated overnight with HIV, were measured by RT-qPCR and normalized to RPL13A. For (c) and (f) the box represents the average±the s.d. The middle line represents the average. The whiskers represent the average±1.96 times the s.d. Data shown as the means of three independent experiments±s.e.m. P values (p) were determined using a two-tailed Student's t test. ***P<0.001, **P<0.01, *P<0.05.

