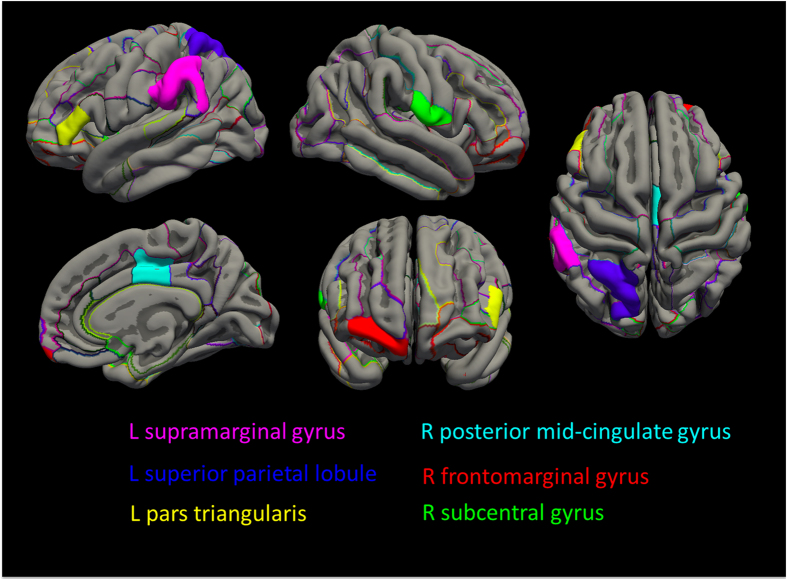
Figure 1. Schematic maps on the cortical regions with significant genotype-by-diagnosis interaction or genotype effect.
The cortical parcellation criteria of the Destrieux atlas was applied. The significant interactive effect of the FKBP5 rs1360780 genotype and major depressive disorder (MDD) diagnosis was observed in left pars triangularis (Pcorr = 0.027), supramarginal gyrus (Pcorr = 0.027), superior parietal lobule (Pcorr = 0.017), and right frontomarginal (Pcorr = 0.043) and posterior midcingulate gyrus (Pcorr = 0.043). In all participants of both the MDD and healthy control groups, T allele was associated with a smaller volume in the right subcentral gyrus among the total participants (Pcorr = 0.001) (R, right hemisphere; L, left hemisphere).

