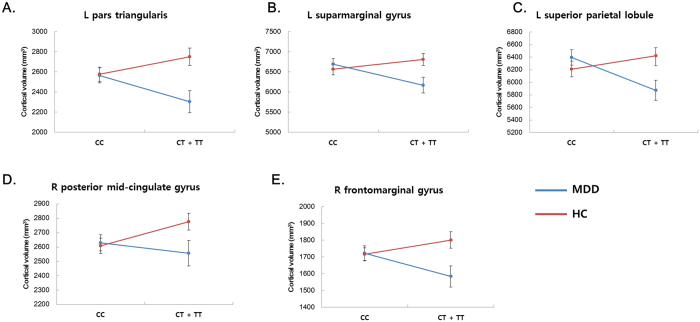
Figure 2. Interaction plot of the cortical volumes with significant diagnosis-by-genotype interactions.
(Panel A = left pars triangularis, panel B = left supramarginal gyrus, panel C = left superior parietal lobule, panel D = right posterior midcingulate gyrus, panel E = right frontomarginal gyrus; MDD, major depressive disorder; HC, healthy controls; CC, CC genotype of rs1360780; CT + TT, CT or TT genotype of rs1360780; L, left hemisphere; R, right hemisphere; error bars represent the standard error of the mean).

