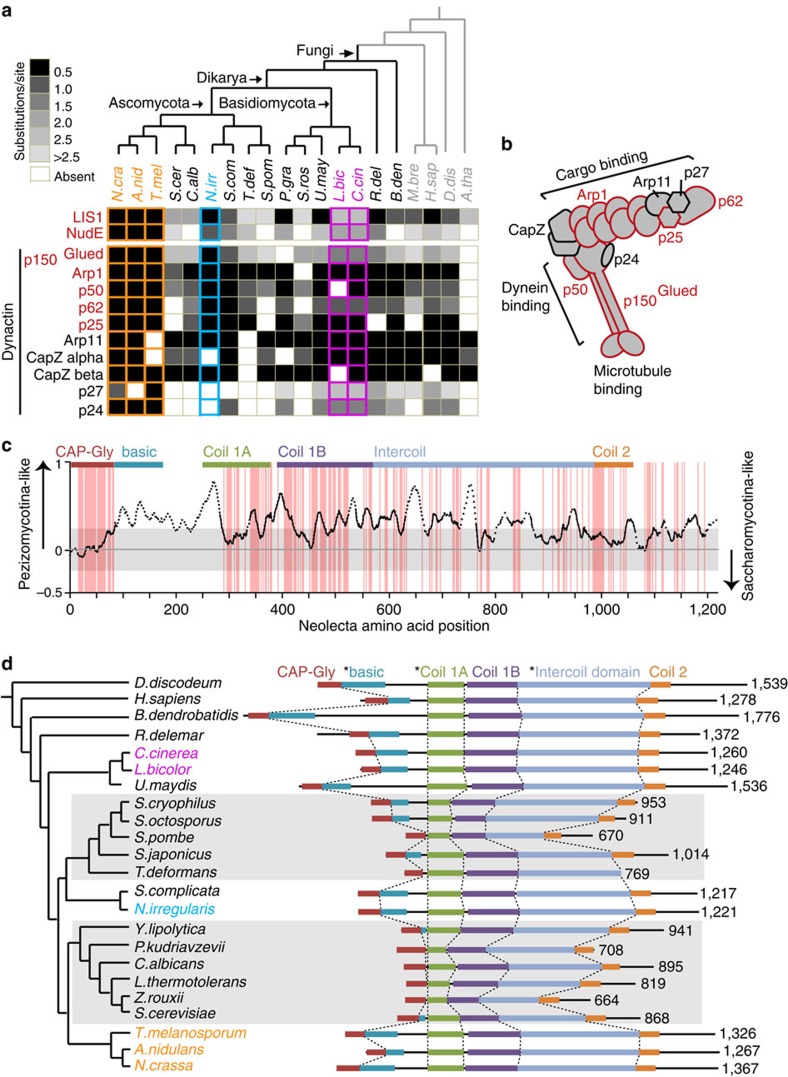
Figure 5. Conservation and divergence of dynein regulators.
(a) Substitution rate analysis of dynein regulators. For the indicated proteins, the degree of sequence divergence compared with the Pezizomycotina is determined by substitution rate and indicated by the greyscale. A lighter shade indicates greater divergence from the Pezizomycotina. Red text indicates proteins identified by our search for CM-associated sequences. This figure is complemented by Supplementary Fig. 5, which shows substitution rate analysis of dynein complex components. (b) The cartoon depicts the structure the Dynactin complex. Components shown in red were identified as CM-associated. (c) Graphical representation of the p150Glued multiple sequence alignment. On the vertical axis, a positive score represents greater similarity between Neolecta and Pezizomycotina homologues while a negative score represents greater similarity between Neolecta and Saccharomycotina homologues (see Methods). The grey box indicates the range of score that could be generated by chance. The dotted line represents regions missing in yeast sequences. Red background indicates residues conserved in Neolecta and both reference groups. p150Glued domains are indicated on top of the plot based on the structure of mammalian p150Glued (ref. 87). (d) Systematic length variation in p150Glued. * indicates the regions that appear to have undergone significant contraction (Mann–Whitney U-test, P-values<10−3) in the two yeast-containing groups (highlighted with grey background). This figure is complemented by Supplementary Fig. 7a, which shows length distribution of contracted domains.

