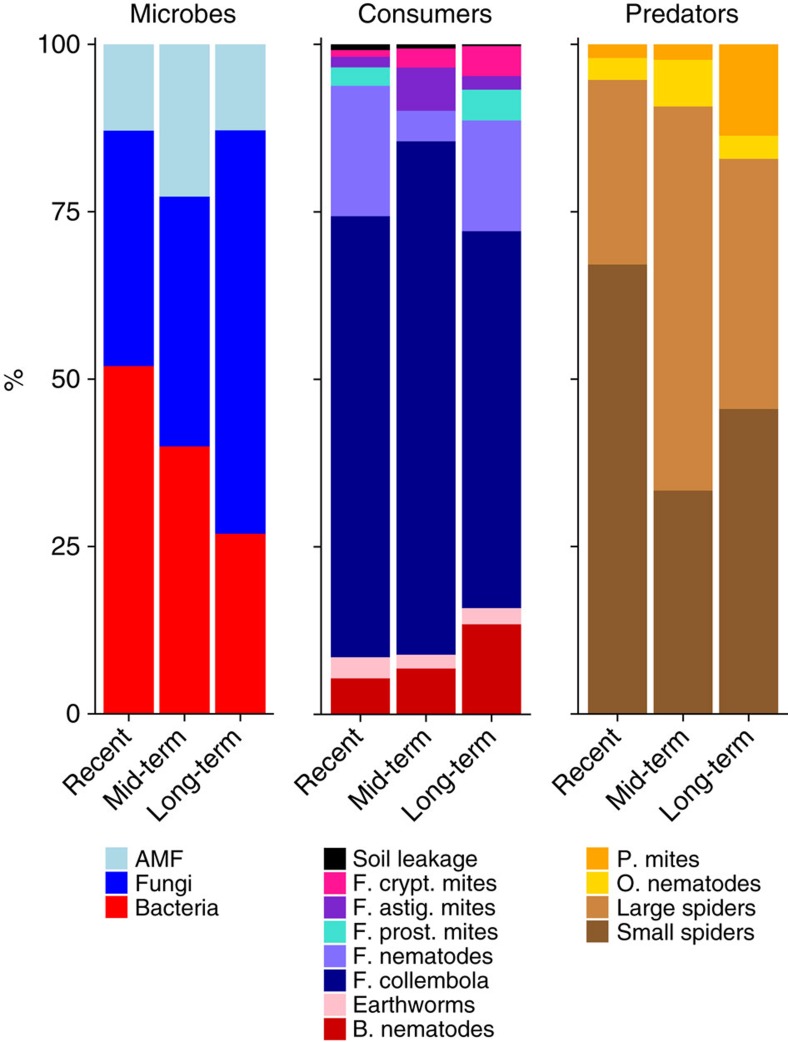
Figure 4. Relative carbon amounts in trophic level along abandonment stage.
The carbon measured at the relevant time points for each group of soil biota. At day 1, the carbon is distributed among microbes. The microbe panel represents relative amounts of carbon exuded by the roots at day 1 after labelling. The total amount of labelled carbon in the roots decreases during succession (Supplementary Fig. 6).We have therefore presented the relative distribution of carbon scaled to the total amount of labelled carbon in the roots as excess 13C (the increase in atom% C values of the labelled compared with natural values measured from non-labelled controls) (bacteria, fungi, AMF). Bacteria (red), fungi (blue) and AMF (light blue) receive carbon from the plant roots. This carbon is distributed into the fungal channel and bacterial channel, where 1 week after labelling it is taken up by fungivorous mites, nematodes, collembola and bacterivorous nematodes and earthworms scaled to the total amount of labelled carbon in the roots as excess 13C. After 2 weeks after labeling, the carbon had reached the predators: spiders (brown), predaceous mites (orange), and omnivorous nematodes (yellow). Values of labels in the predators were also scaled to the total amount of labelled carbon in the roots as excess 13C. Absolute values for these groups are shown in Fig. 2. B, bacterivorous; F, fungivorous; O, omnivorous; P, predaceous.

