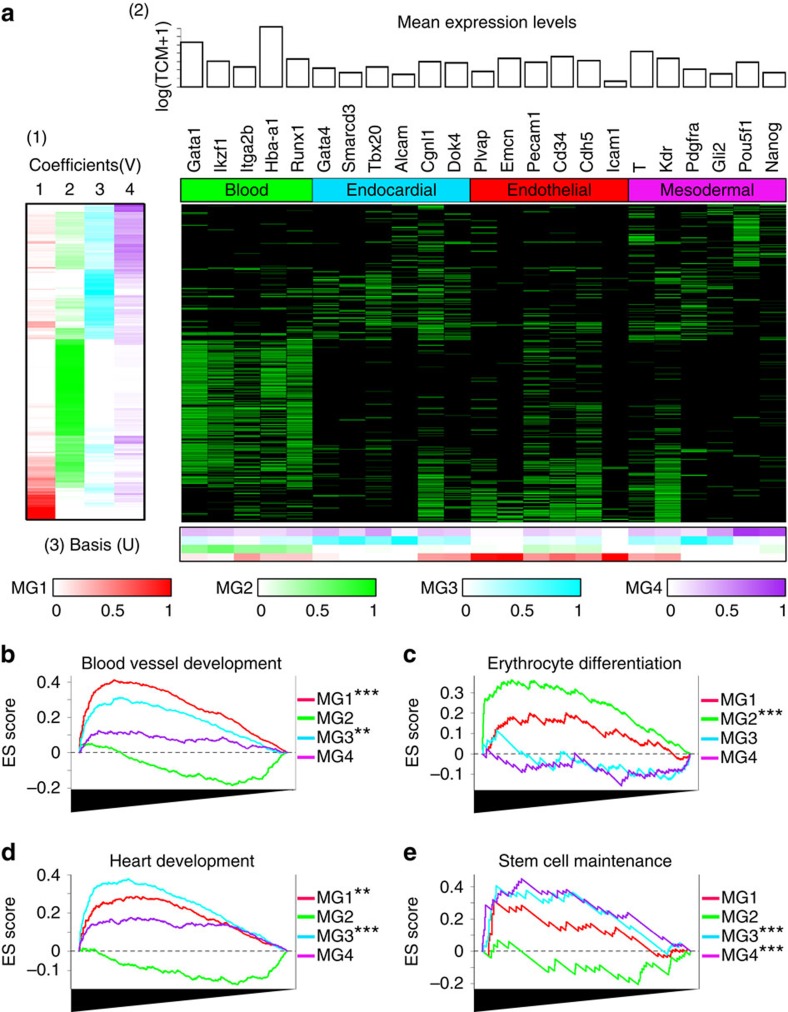
Figure 1. dpath successfully separated Etv2-EYFP+ cells into four metagenes.
(a) Wp-NMF decomposed the expression profile matrix of Etv2-EYFP+ cells into metagene coefficients and metagene basis. Selected markers of expected lineages were used to identify the lineage represented by each metagene. (1) The heatmap showed the cell-wise metagene coefficients. Every row represented a single cell and the colour indicated the expression intensity of metagenes in each cell (cell-wise metagene signature). (2) Bar plot indicated the median expression levels of a list of known marker genes for haematopoietic, endocardial and endothelial lineages and the mesodermal progenitors across all 291 single cells. The heatmap showed each gene's observed cell-wise expression levels, scaled to a minimum of zero (black) and a maximum of one (green). (3) The heatmap showed the metagene basis for selected marker genes. Every column represented a gene and the colour indicated the contribution of each gene to each metagene. (b–e) GSEA showed that genes ranked by the correlation between their expression levels and cell-wise metagene coefficients of four metagenes were significantly associated with distinct Gene Ontology terms (*0.01≤P value <0.05; **0.001≤P value <0.01; ***P value <0.001. The statistical significance (nominal P value) was estimated by the permutation test. In each panel, x axis indicated the genes ordered according to the correlation between their expression levels and cell-wise metagene coefficients, and y axis indicated the ES score from the GSEA.

