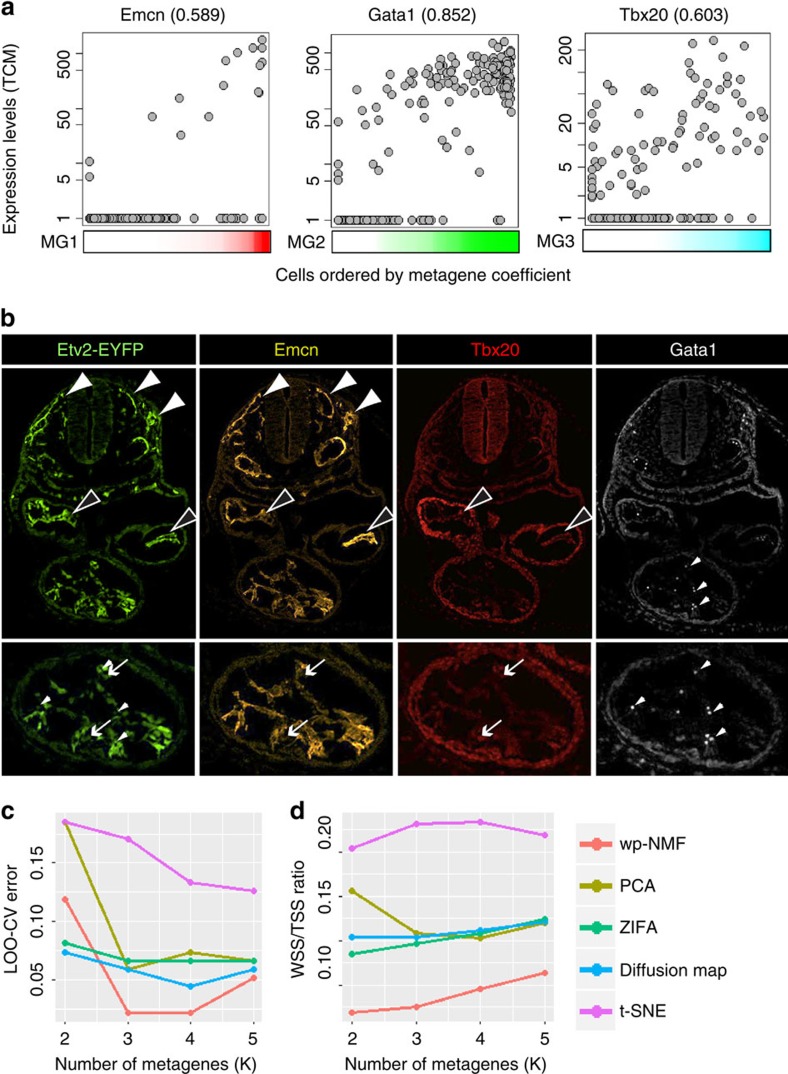
Figure 2. The metagene signature using wp-NMF successfully separated cell clusters with distinct spatial distribution.
(a) The scatter plot showed the relationship between the expression levels of Emcn, Gata1 and Tbx20 and the metagene coefficients of MG1 (endothelium), MG2 (blood) and MG3 (endocardium). The Pearson's correlation coefficients in the parenthesis were computed between the expression levels and the metagene coefficients. (b) Immunohistochemical techniques were used to locate cell populations identified by the metagene signature. A transverse section (at the level of the heart) of an E8.25 mouse embryo was stained using antibodies to EYFP, Endomucin (Emcn), Tbx20 and Gata1 (from left to right). Note that EYFP-positive populations segregated into three distinct populations, EYFP+Emcn+Tbx20−Gata1− endothelial cells (closed arrowhead), EYFP+Emcn+Tbx20+Gata1− endocardial cells (open arrowheads) and EYFP+Emcn−Tbx20−Gata1+ blood (small arrowheads). (c,d) Wp-NMF had superior performance for the separation of Emcn+/Gata1−/Tbx20−, Emcn−/Gata1+/Tbx20− and Emcn−/Gata1−/Tbx20+ among the Etv2-EYFP+ cells compared with PCA, dimensionality reduction for zero-inflated single-cell gene expression analysis, diffusion map and t-distributed stochastic neighbour embedding. In both panels, x axis indicated the number of hidden dimensions (K), and the y axis represented (c) leave-one-out cross validation (LOO-CV) error and (d) WSS (within-cluster sum of squares)/TSS (total sum of squares) ratio.

