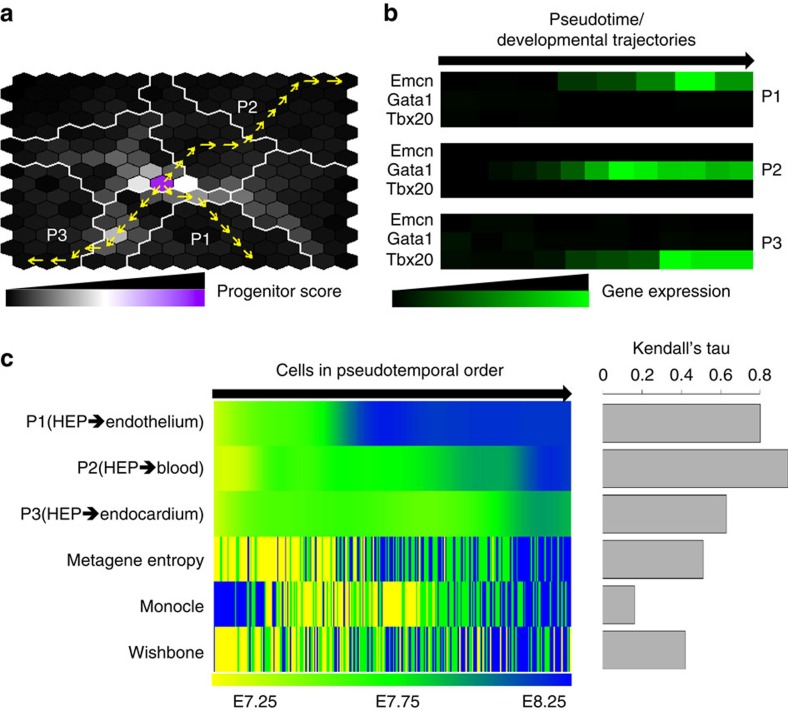
Figure 5. dpath allows the definition of the developmental trajectory and hierarchy of lineages.
(a) The developmental trajectories were indicated from the high entropy progenitor (HEP) cellular state toward the committed cellular states of endothelium, blood and endocardium. The most likely progenitor cellular state and committed cellular states were determined by a RWR algorithms on a metagene–metacell heterogeneous graph. The developmental trajectories between the progenitor and committed cellular states were determined as the shortest paths (between the progenitor and the committed/differentiated cell) on the metacell landscape. P1, P2 and P3 represented the predicted developmental trajectories toward committed endothelial, committed haematopoietic and committed endocardial lineages. (b) The heatmaps show the expression pattern of Emcn, Gata1 and Tbx20 along the trajectories P1, P2 and P3. (c) The Kendall rank correlation coefficients between the pseudotime and temporal labels (E7.25, E7.75 and E8.25) were used to evaluate the performance of trajectory inference. For dpath, the lineage-specific cells were ordered into pseudotemporal order along three separate trajectories P1, P2 and P3, respectively. The cells were also reordered merely based on their metagene entropy. For Monocle and Wishbone, we used the cell-wise pseudotime reported by the algorithms.

