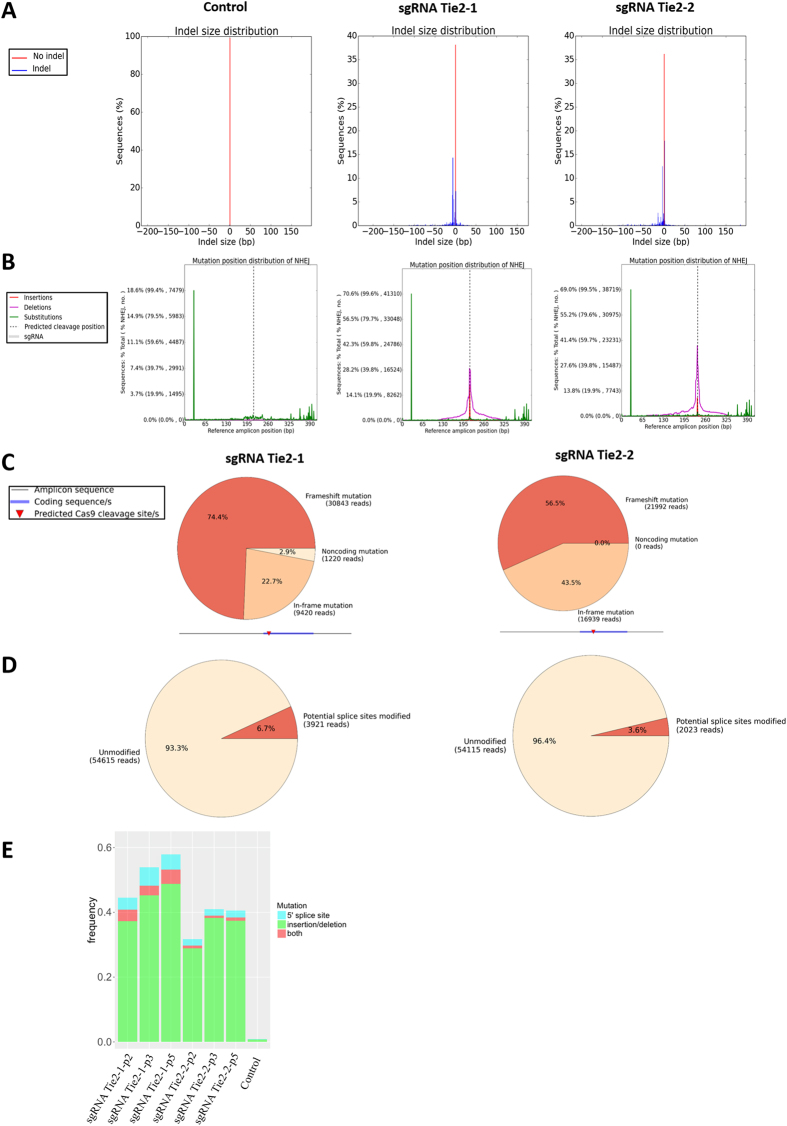
Figure 2. Analysis of CRISPR-Cas9 induced Tie2 gene mutations using next-generation sequencing.
(A) Indel size distribution of wild-type cells (control) and cells transduced with two different sgRNAs targeting Tie2 (sgRNA Tie2-1, sgRNA Tie2-2). (B) NHEJ reads with insertions, deletions, and substitutions were mapped to reference amplicon position. Sequencing/alignment errors (green lines) can be distinguished from indels by their similar positions in all three samples. (C) Frameshift mutagenesis profile and predicted Cas9 cleavage site. Unmodified reads are excluded from this analysis. sgRNA Tie2-1 and sgRNA Tie2-2 showed different percentage of reads with mutations from frameshift, in frame, and in noncoding region. (D) Predicted impacts on splice sites. Potential splice sites modified refers to the reads in which either of the two introns adjacent to the exon is disrupted. (E) The relative contributions of potentially disruptive coding region mutations (indels) and non-coding region mutations (5′ splice site) were quantified across 3 passages. SNPs, in-frame indels, indels less than 5 residues, and 3′ splice site mutations were excluded.

