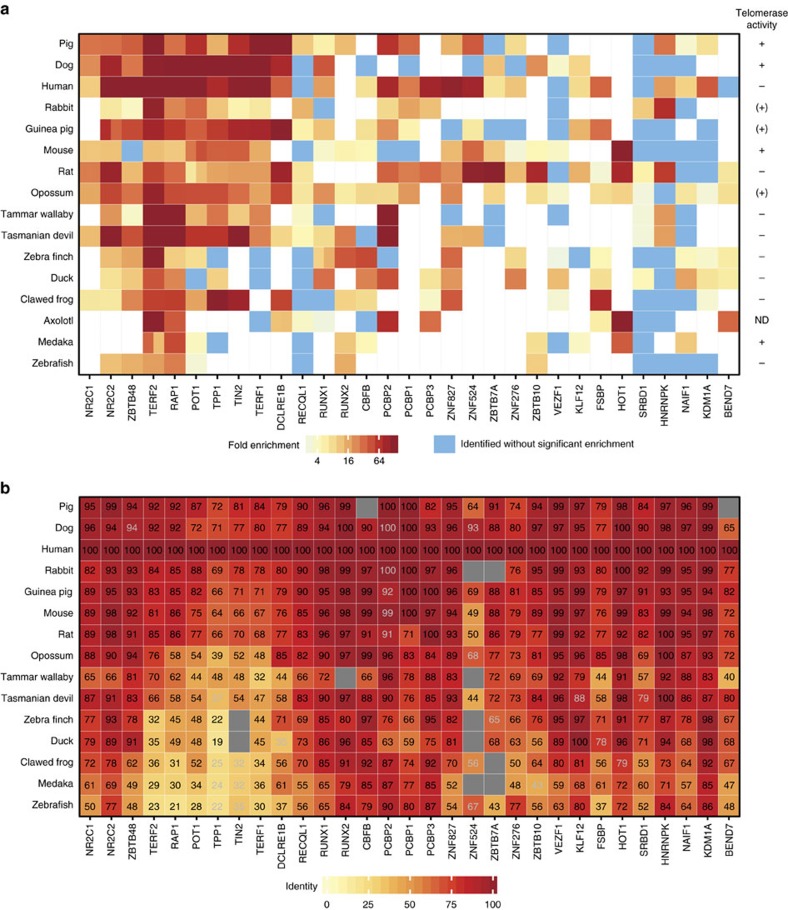
Figure 2. Telomere-binding proteins are identified by cross-species validation.
(a) Heat map of identified proteins with specific enrichment at TTAGGG repeats in at least 5 out of the 16 vertebrate species. Species (rows) are arranged according to their phylogenetic relations while proteins (columns) are clustered based on their binding pattern across all pull-downs. Colour gradient represents relative enrichment from TTAGGG binding (red) to equal enrichment on the telomeric and control sequence (blue). Only events that were identified as hits according to the criteria in Fig. 1c are shown. Gene names are based on the human versions, and in the occurrence of paralogues, both enrichment values are displayed side by side in the species concerned (for example, POT1 in mouse). The presence of telomerase activity is indicated on the right. (+) indicates cell lines with activity at the detection limit. IMR90 (human)47 and NIH3T3 cells (mouse)48 are known telomerase-negative and -positive cells, respectively. Quantifications can be found in Supplementary Fig. 2. (b) Heat map of protein sequence identity for all candidate telomere binders from a across 15 vertebrate species. Axolotl was excluded from this analysis as there is currently no published whole-genome annotation available. The protein sequence identity is displayed as a colour gradient relative to the human sequences with the percentage value displayed in each square. Grey squares represent absent genes based on ENSEMBL genome assemblies. Grey values represent non-annotated homologues based on ENSEMBL genome assemblies for which we could identify homologues by reciprocal BLAST search.

