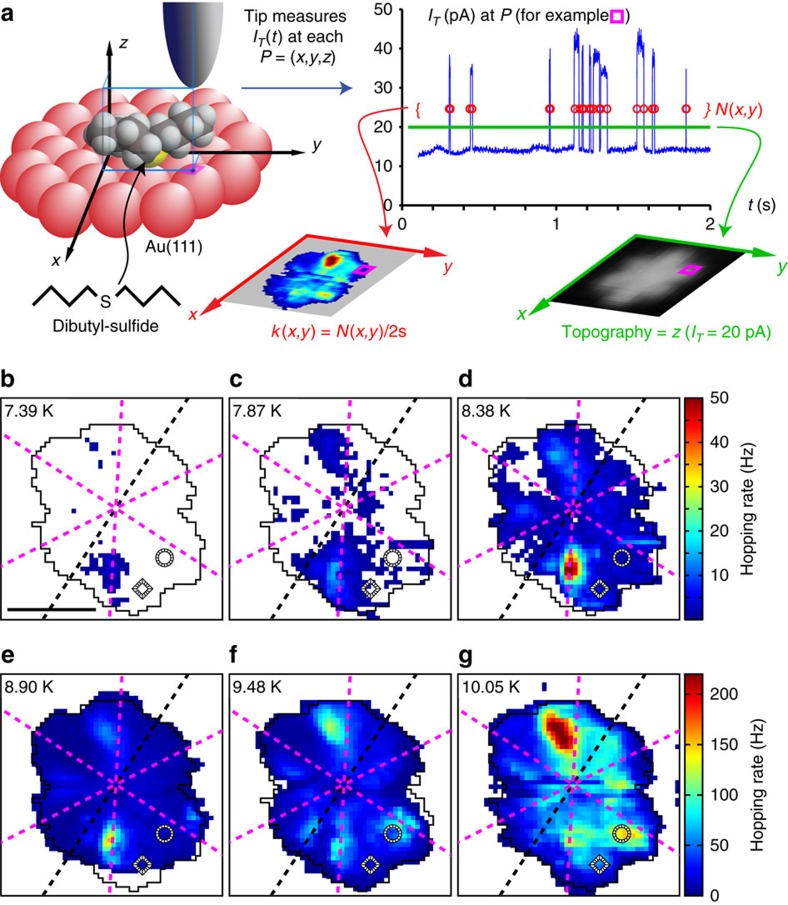
Figure 2. Hopping rate measurement and analysis.
(a) Measurement principle: a dibutyl sulfide molecule adsorbed on the Au(111) surface (top left) is scanned at a rate of 400 s per line (both directions). z-feedback keeps the average tunnelling current constant at 20 pA and results in the topography image (bottom right). Telegraph noise recorded at a high measurement bandwidth (top right) allows identifying and counting the N molecular hops occurring over the 2 s span that the tip spends over each position (x, y), and results in the hopping rate k(x, y, T) (bottom left). (b–g) Maps of the hopping rate k(x, y, T) highlight the influence of both temperature and relative molecule-tip position (x, y). Scale bar, 1 nm. Note that in these and all subsequent spatial maps, the colour white indicates regions where no hopping was discerned using this technique. The black/white striped ring and diamond markers identify two specific positions r1 and r2 for further analysis in Fig. 3. The dashed black line is parallel to the nearby herring bone ridge, while the dashed magenta lines indicate the symmetry axes (rows of atoms) of the Au(111) surface. The black contour outlines the region utilized for further analysis, containing non-zero rates for at least three temperatures. The hexagonal shape of this contour is reminiscent of the typical hexagonal shaped appearance of STM topography map of the molecule typically occurring at higher temperatures (Fig. 1g).

