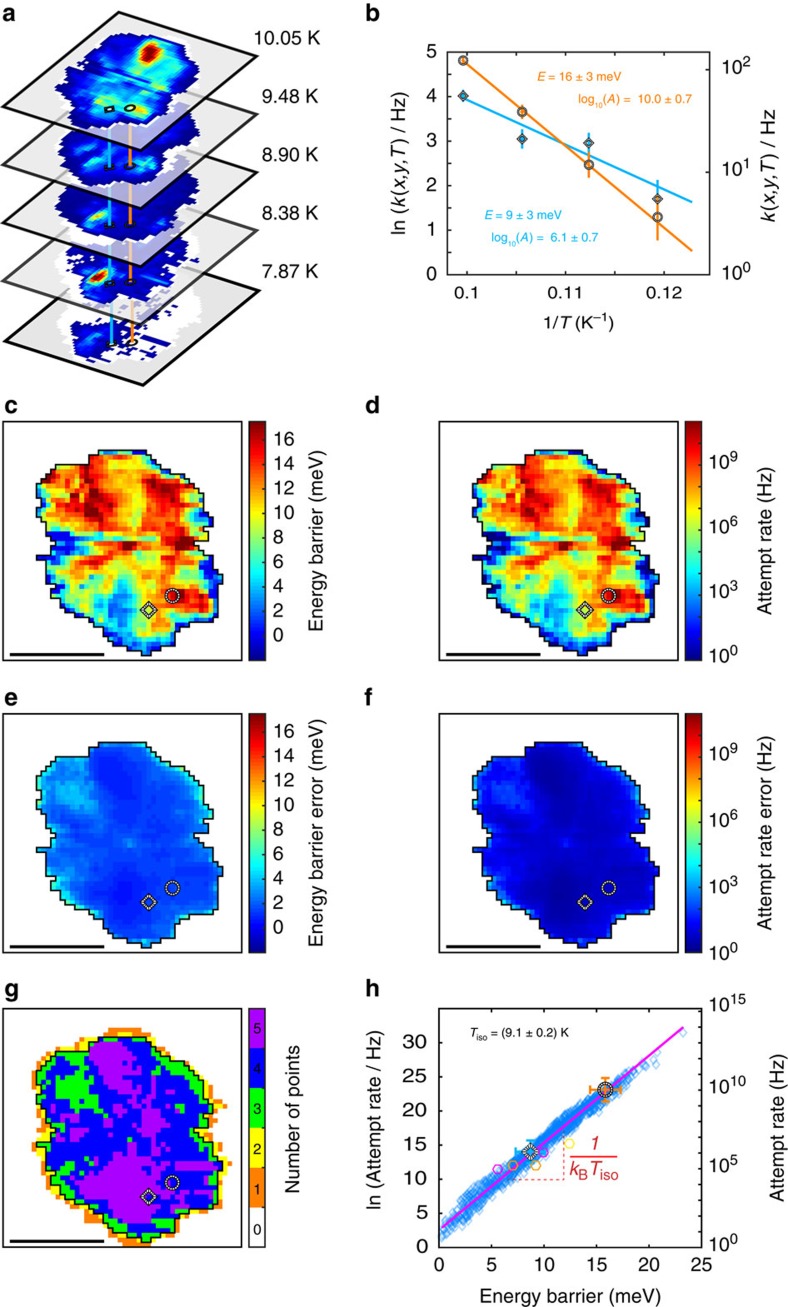
Figure 3. Arrhenius equation parameters from fits to the hopping rate k(x, y, T) of Figure 2b–g.
(a) Schematic of the procedure followed to obtain sets of position dependent hopping rates k(x, y, T) for fitting with equation (1). The black/white striped ring and diamond markers identify two selected (x, y) positions across temperatures. (b) Arrhenius plots of k(x, y, T) for the two positions corresponding to the striped markers in (a) and Fig. 2. (c,d) Apparent energy barrier E(x, y) and apparent attempt rate A(x, y) from fitting equation (1) to each (x, y) hopping rate temperature series. (e,f) Error of the measurement of (c,d), respectively. (g) Number of points in the temperature series contributing to position-dependent hopping rates for each (x, y). (h) Plot of all pairs of ln(A(x, y)) and E(x, y) from (c,d) (blue diamonds), and the line fit (magenta line) showing the compensation effect between E and A from which an isokinetic temperature Tiso follows. Values for fcc and hcp adsorption sites obtained from literature are indicated by hexagons in yellow21 (fcc), magenta23 (fcc) and orange23 (hcp), respectively. All errors in the figure are s.d. Scale bars in (c–g), 1 nm.

