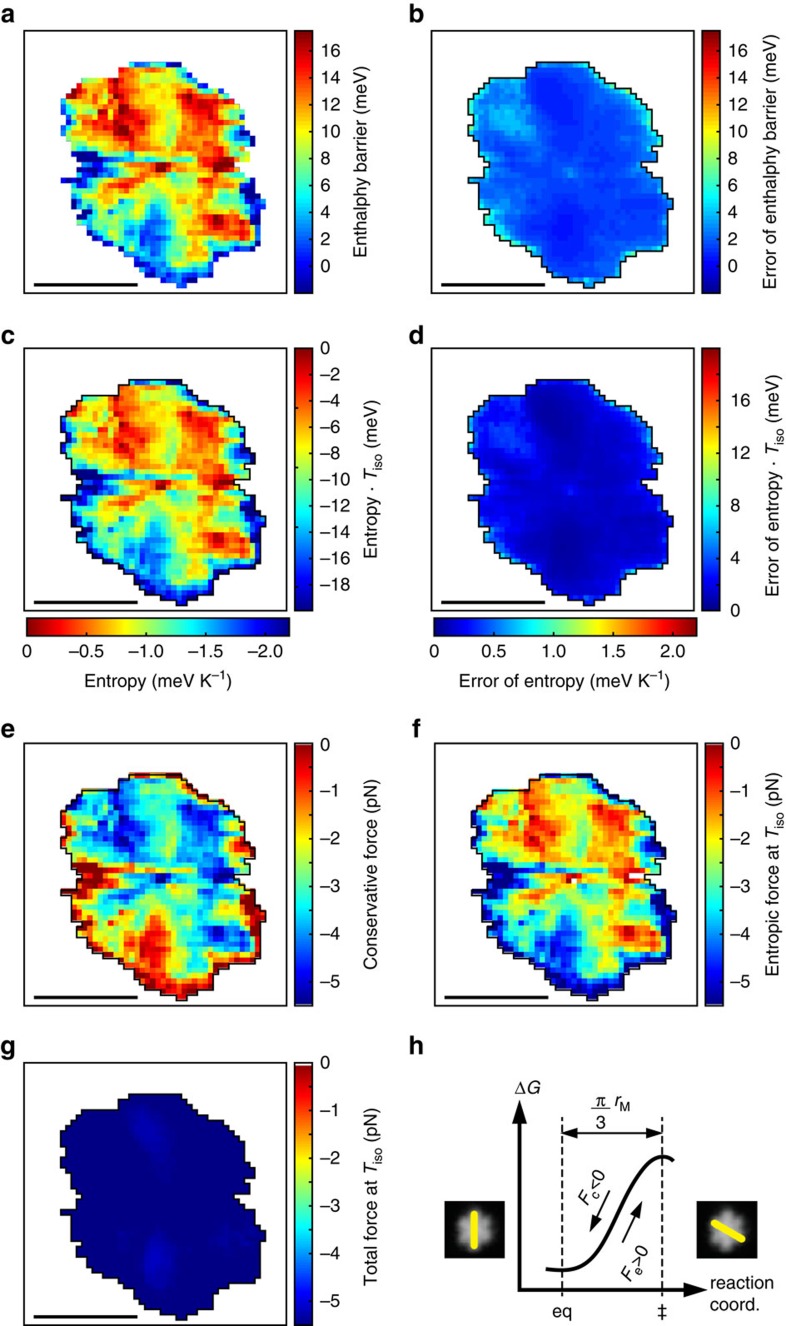
Figure 4. Enthalpy, entropy and derived conservative and entropic forces derived from the data in Figure 2b–g.
(a) Map of the enthalpy change ΔH‡ obtained by fitting the rate maps from Fig. 3a with the logarithmic form of equation (1) using equation (5) for the (weakly) temperature dependent attempt rate, and ΔH‡(x, y)≡E(x, y). (b) Corresponding error. (c) Entropy difference ΔS‡ from the fit of (a). The right hand scale bar is a scale of the corresponding thermodynamic potential at Tiso, which can be compared with (a). (d) Corresponding error. (e) Conservative force, derived from (a). (f) Entropic force at Tiso, derived from (c). (g) Sum of conservative and entropic forces at Tiso, from (e,f). (h) Schematic of the free energy change along the transition axis, indicating the sign convention for the conservative, Fc, and entropic, Fe, forces on the molecule. All errors in the figure are s.d. Scale bars in (a–g), 1 nm.

