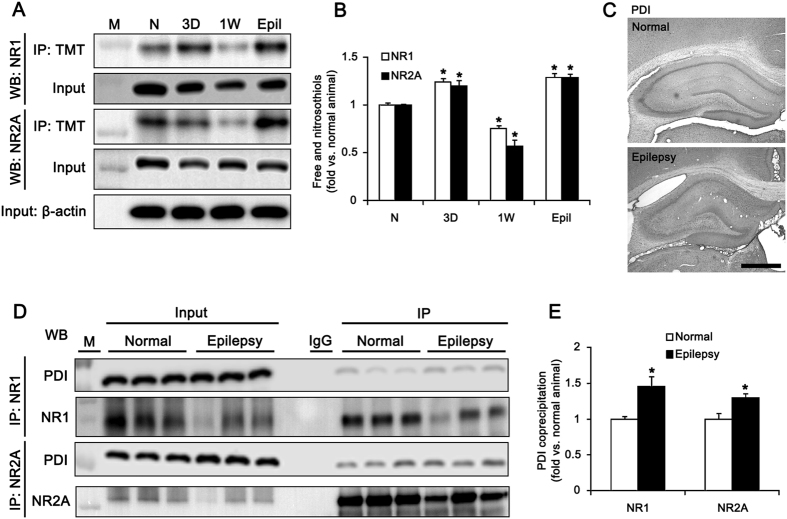
Figure 5. Changed redox status of NMDAR by PDI in epileptic rats.
(A) Western blot data for the amounts of -SH + -SNO of NR1 and NR2A subunits in non-SE (N), 3 day-post SE (3D), 1 week-post SE (1W) and chronic epileptic (6 week-post SE, Epil) animals. M, molecular weight marker. (B) Quantification of the amount of -SH + -SNO on NR1 and NR2A (mean ± S.E.M.; *p < 0.05 vs. normal; n = 7, respectively). The amounts of -SH + -SNO of NR1 and NR2A are increased 3 days after SE, and subsequently recovered to normal normal level 1 week after SE. (C) Representative photos for PDI expression in the normal and epileptic hippocampus. Bar = 300 μm. (D) Co-immunoprecipitation analyses of NR1 and NR2A interaction with PDI in normal and epileptic animals. M, molecular weight marker. (E) The quantitative analyses of co-immunoprecipitation of PDI with NR1 and NR2A in normal and epileptic animals (*p < 0.05 vs. normal; n = 7, respectively). In chronic epileptic animals, the amount of -SH + -SNO of NR1 is increased, as compared to normal animals.

